
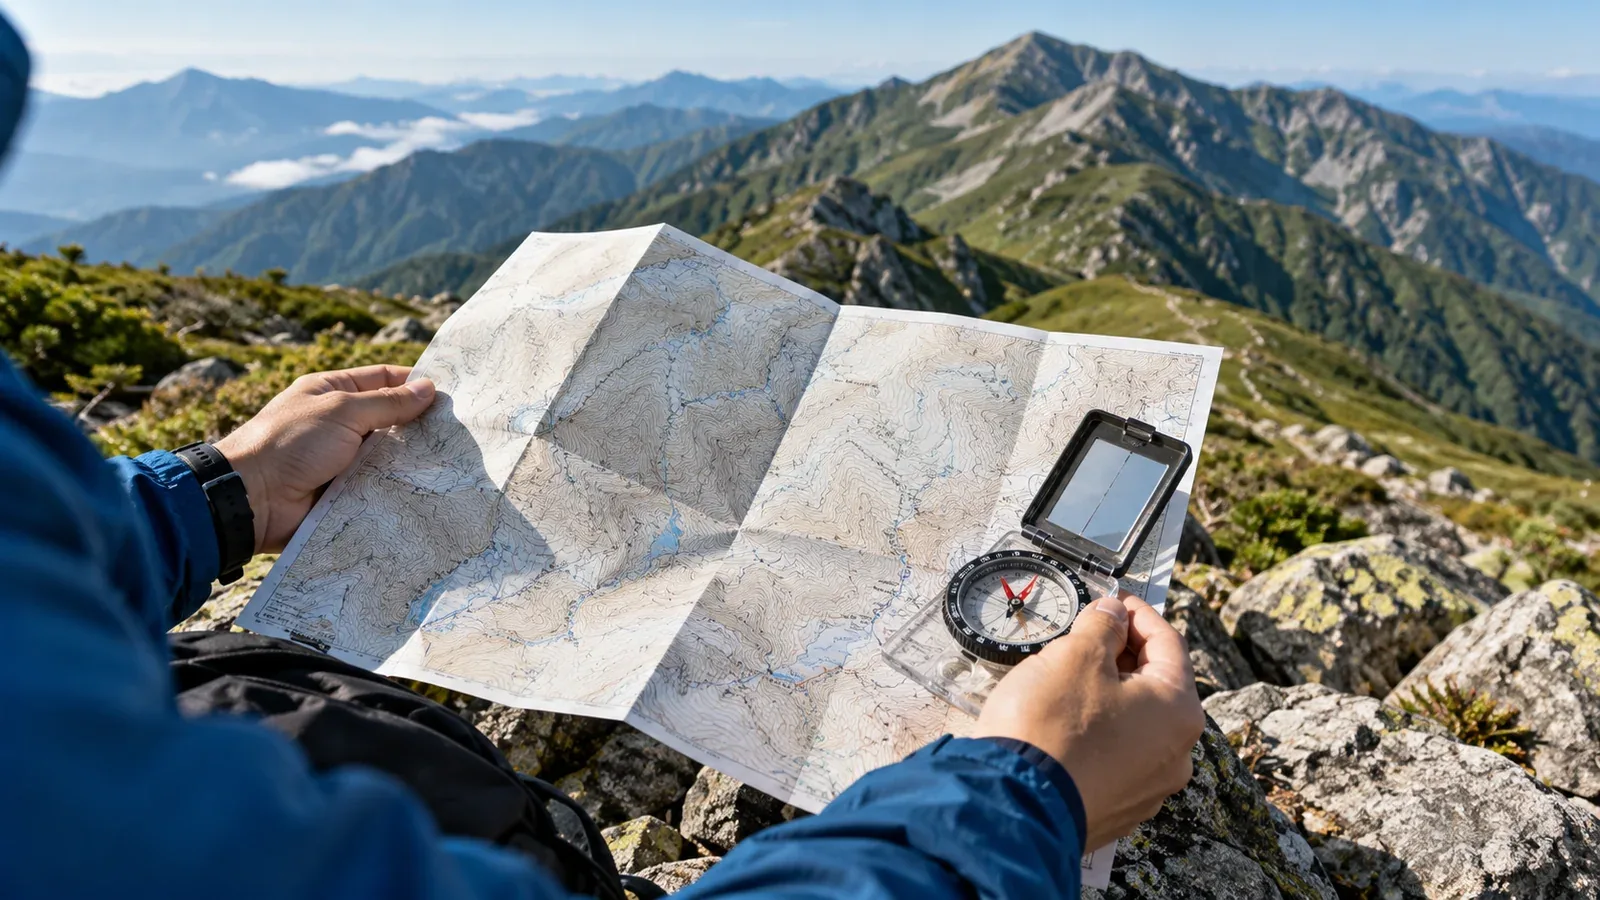
Japan’s Geospatial Information Authority (GSI) publishes topographic maps that show terrain, paths and land cover. The symbols can look dense at first. Start with the features that help you plan where to walk, where to slow down and what to check before leaving.
Some hiking apps use GSI map data. The available layers and symbols vary by app and zoom level. Looking at the GSI map and its legend can reveal details you missed in the app, such as closely spaced contours or a marked cliff.
Read the slope from contour lines
A contour connects points at the same elevation. On a map with the same scale and contour interval, lines close together show a steeper slope.
On GSI’s 1:25,000 topographic maps, the ordinary contour interval is 10 m and the heavier index contour interval is 50 m. In some places there are supplementary contours. At the original scale, 1 cm on the printed map represents 250 m of horizontal distance. Check the scale bar after printing or resizing.
Look for changes in spacing along the route. Closely packed lines can mark a steep climb or descent where you may need more time. Surface, weather and the direction of travel also affect how a section feels.
A contour crossing a valley generally bends toward higher ground. Where it crosses a ridge or spur, it bends toward lower ground. Follow the elevation labels and look for streams and the shape of the surrounding contours. When visibility is poor, stop safely and confirm your position before moving on.
Read trail and terrain symbols
Check the legend for the map series or layer you are using. The width and pattern of a line are meaningful, and the same feature may be shown differently at another scale.
Lines for paths and roads
- Solid road lines. The legend uses different line styles for several road types and widths. A thin solid line alone does not tell you that a route is a hiking trail.
- Broken lines. The standard GSI 1:25,000 legend uses a broken line for a mapped footpath less than 1 m wide. Compare it with the separate symbol for a narrow road. The marking describes a mapped feature and does not indicate its current condition.
- No mapped line. A path can be omitted or added after the map was updated. Follow established, open routes that you can verify and keep off closed or restricted ground.
Before following any marked route, check with the relevant park, municipality or trail manager. Landslides, fallen trees, repairs or overgrowth can change access before the base map is updated.
Vegetation and ground-cover symbols
Broadleaf forest, conifer forest and other ground-cover symbols help you picture the surroundings. A vegetation symbol does not tell you how dense the undergrowth is or whether the trail is clear. Compare the map with aerial imagery and recent local reports.
Cliff and rock symbols
Use the legend to identify the marks for earth cliffs, rock cliffs and exposed rock. Where a trail passes close to a mapped cliff, allow for exposed terrain. On the ground, check footing and exposure even where no cliff is marked, especially when the rock is wet or icy.
Magnetic north and compass use
On a standard GSI 1:25,000 sheet, the map is oriented toward true north. A magnetic compass points toward magnetic north. The angle between the two is magnetic declination.
Declination varies with place and time. Check the value and reference date printed on the sheet or use the GSI geomagnetic information for the area. The GSI’s online map and calculator state the reference epoch used for their estimates.
GSI Maps can display a magnetic north line. If you transfer that line to a paper map, orient the sheet using the correct local direction. When taking a bearing, use either the magnetic north lines or the compass declination correction so that you apply the adjustment once.
What to check before leaving with GSI Maps
The free GSI Maps website provides topographic maps, aerial imagery and tools for exploring terrain. Select the appropriate base map and check its scale and legend.
Elevation profile. Draw a line along the actual planned route, with points at bends and junctions. The profile shows estimated elevation along that line. A straight segment across a bend can cut off part of the climb or cross terrain you will never walk.
Map overlays. Compare aerial imagery, volcanic maps or available hazard layers. Look at each layer’s date and coverage, and check current official notices for conditions and closures.
Printing. Use the desktop print function to cover the full route and alternatives, or carry a suitable printed sheet. Include the scale, legend and north reference, and check they are readable. Bring a compass and know how to use the printed map before you leave.
The website’s controls can change and some tools differ between phone and desktop. Use the GSI’s current instructions to confirm the steps.
What a topographic map cannot tell you
A topographic map describes terrain and mapped features. A route plan also needs current information about access, trail condition and the people who will walk it.
Time between updates. New bridges, closed forest roads and changed paths may take time to appear. Check the date and look for notices about changes along your route.
Trail condition. A mapped footpath can have a washout, deadfall or closure. Check the authority responsible for the trail and use recent local information from visitor centers or huts as additional context.
Walking effort. Two slopes with similar contours can take very different amounts of time if one is rocky, brushy or covered in snow. Use the map to estimate steepness and compare it with the surface and conditions you expect.
Before your next hike
Open your planned route in GSI Maps and mark the steep sections, cliff symbols and key junctions. Draw its profile, then compare the plan with current notices and the time you have. Bring a map covering the route and alternatives, and use it to check what you see on the ground.
References
- Geospatial Information Authority of Japan: GSI Maps
- Geospatial Information Authority of Japan: 1:25,000 topographic map symbols
- Geospatial Information Authority of Japan: geomagnetic values and declination
References and sources
- Geospatial Information Authority of Japan: GSI Maps
- Geospatial Information Authority of Japan: 1:25,000 topographic map symbols
- Geospatial Information Authority of Japan: geomagnetic values and declination
- GSI: topographic map contour intervals
- GSI: footpath symbol
- GSI Maps: direction and magnetic north
- GSI Maps: drawing an elevation profile
- GSI Maps: printing and saving a map
- GSI: updates to mapped mountain trails