
The shortcut that an extra 1 m/s of wind lowers the feels-like temperature by 1°C is too limited to judge cold or safety in the mountains. Even matching the wind and temperature inputs does not make the shortcut valid. This article distinguishes rough rules from an index with stated conditions and shows how to use forecasts and record what you encounter.
What the “1°C per 1 m/s” shortcut can tell you
The Japan Weather Association’s tenki.jp article on cold mentions the rule that a 1 m/s increase in wind reduces the feels-like temperature by 1°C. That passage gives no formula or conditions for applying it. Use the explanation as a reminder to consider wind, and check a defined index before using a numerical value.
The same article notes that rain, sunlight and humidity also affect how cold you feel. Wind speed alone cannot compare wet clothes with dry ones or sunshine with shade. The ratio of the thermal conductivity of water and air does not equal the ratio at which a person’s body temperature falls. Consider equipment and how each person is doing.
The US National Weather Service wind chill index is one example with defined conditions. It is based on heat loss from exposed skin and applies at temperatures at or below 50°F (10°C) and wind speeds above 3 mph (approximately 1.34 m/s), with assumptions that include no effect from sunlight. It is more complex than subtracting a fixed amount per unit of wind speed. It does not directly give your body temperature or your personal safety with particular clothing and wetness. Check the definition used by an app or other service.
Check whether the wind speed is a mean or a gust
The Japan Meteorological Agency (JMA) uses a 10-minute mean up to the observation time. Its current gust speed is a three-second average of 12 samples taken 0.25 seconds apart. The 15:00 average covers 14:50 to 15:00. The AMeDAS map rounds the hourly value to the nearest 1 m/s, although other tables may use different precision.
Maximum wind speed is the highest 10-minute mean in the period, and maximum gust is the highest gust reading. Even on the same day the peaks may occur at different times. Follow the index instructions for the type of wind reading and its measurement height.
Gusts can be stronger than the mean, but multiplying the mean by a fixed factor cannot predict future gusts. Adding the “1°C per 1 m/s” shortcut then gives no valid range for how cold you will feel. Precise-looking results from those assumptions are not measurements of how cold it was on the trail.
The JMA announced its measurement change in 2007, which explains the older 0.25-second values and the current three-second mean. The current definition is clear. Hand-held anemometers can use different methods, so check your manual for averaging time and what each display means.
Where was the wind measured, and at what elevation was the temperature?
The JMA’s wind table notes that terrain and buildings can make the wind at a place differ considerably from that at a nearby station. A ridge and valley can have different conditions even within the same named area. Check the location and time for both air temperature and wind.
The station at the foot of a mountain provides context. It does not measure a point on a ridge. If the forecast or nearby observation seems different from conditions on the trail, check the place and time before concluding either is wrong. If you sense danger, act safely first and compare later.
A temperature estimated from elevation remains an estimate. Combining a temperature estimate with a wind shortcut does not establish the destination’s feels-like temperature. On paper, give lowland measurements, mountain forecasts and your own assumptions separate fields, marking what remains unknown.
What to record before using numbers on the mountain
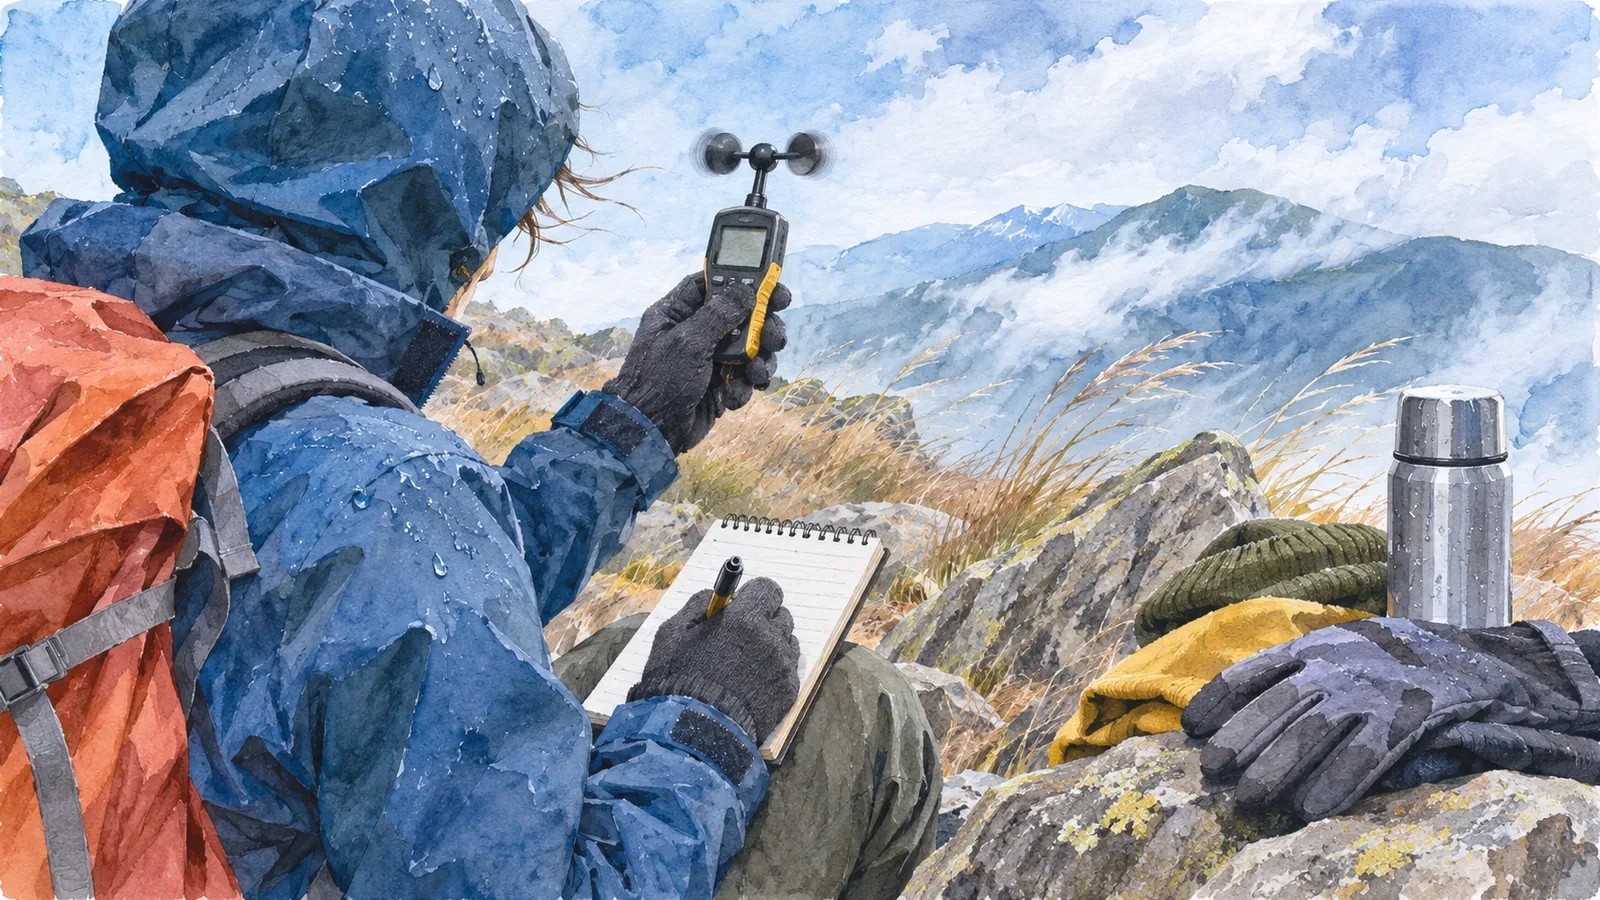
This is our suggested format. Only if there is time and a safe place to stop, note the time, location, terrain and source of the temperature and wind. If you used an instrument, record the display type and measuring conditions. Keep perceived strength as an impression. Watching for ten minutes does not give you a measured 10-minute mean. You can leave the wind and rain rather than wait to complete a record.
Write the direction the wind came from. A wind from north to south is a north wind. Official wind direction uses true north, so keep it separate from a reading based on magnetic north. Record rain, wet clothing, sunlight, warm layers, cold and difficulty walking in separate fields to review differences that wind speed alone cannot explain.
The JMA’s wind table gives typical effects such as difficulty walking and falls. Similar wording does not let you work backwards from walking difficulty to a wind speed. Footing, load and fatigue vary too. Keep descriptions such as “felt strong” or “difficult to keep my balance” separate from measured values.
At home, compare your notes with forecasts and observations for the same period and review the differences and your preparations. A handful of impressions cannot validate a shortcut. Trips with different clothing and effort provide experience for next time, without the control of an experiment.
Read the feels-like number and local conditions separately
Check what the feels-like number means and where it applies. Distinguish means and gusts, station and mountain information, and measurements and estimates. Consider wetness, equipment and physical condition as well as wind. Record what you can from a safe place and avoid enduring cold or walking difficulties to continue measuring.
References and sources
- Japan Weather Association tenki.jp, What hikers should know about cold (September 11, 2025)
- US National Weather Service, Understanding Wind Chill
- Japan Meteorological Agency, Questions about wind
- Japan Meteorological Agency, Wind terminology
- Japan Meteorological Agency, Change to the method for measuring gusts (October 26, 2007)
- Japan Meteorological Agency, Wind strength and its effects