
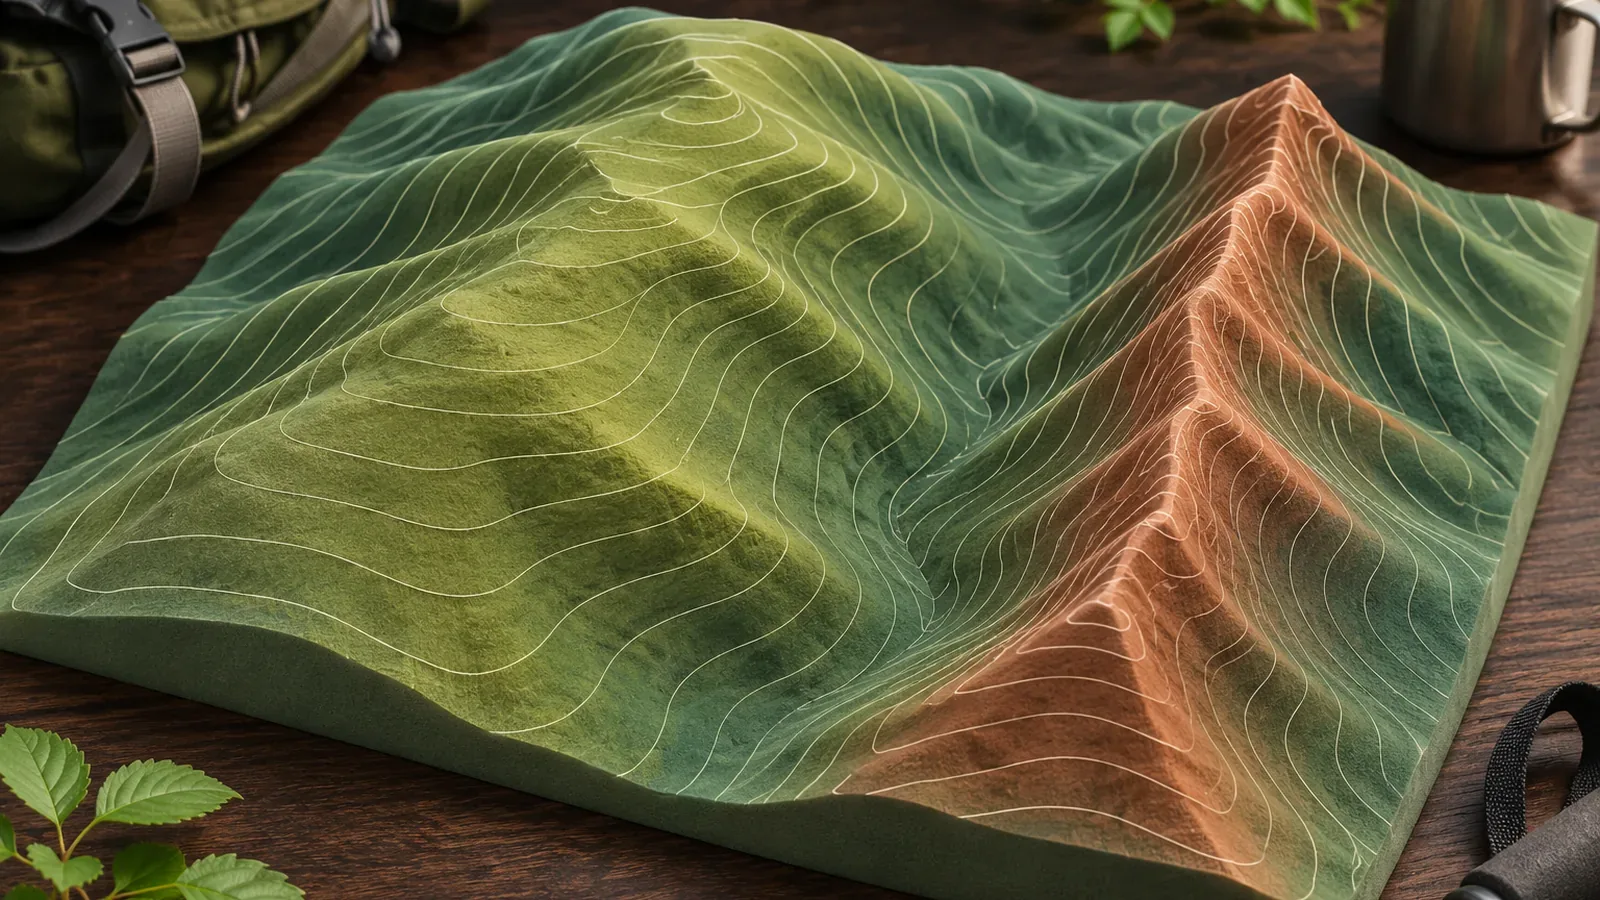
Contour spacing tells you about the steepness of a slope. Ridge width is a separate measurement. The Geospatial Information Authority of Japan material checked on October 28, 2026, gives no method for deriving ridge width from spacing. As a practice exercise, record contour spacing, ridge shape, and width separately, and distinguish what you can establish from what still needs checking.
The spacing is the horizontal distance for one elevation step
A contour connects points at the same elevation. Each line represents one elevation. On GSI's 1:25,000 topographic maps, intermediate contours are 10 m apart vertically and thicker index contours are 50 m apart. At 1:50,000 the intervals are 20 m and 100 m. Commercial hiking maps may use different intervals, so check the legend of your map.
For a given contour interval, closer lines indicate a steeper slope because the elevation changes over less horizontal distance. Wider spacing suggests a gentler slope. GSI also presents a rough method using a 2 cm diameter circle on a 1:25,000 map, equivalent to 500 m horizontally. Count the 10 m contours in the circle, including the thicker 50 m index contours as part of that sequence and leaving out supplementary contours. Use the method only up to 40 lines. Examples of 13 lines for about 13°, 27 for about 27°, and 31 for about 31° are approximations. The number of lines and angle aren't exactly equal. Don't use the rule unchanged above 40 lines or at a different scale.
Keep the difference in elevation separate from the distance on paper. If 2 cm represents 500 m, 1 mm represents 25 m, as the editors calculated from the source. Suppose two neighboring 10 m contours are 4 mm apart on the map. That represents 10 m of elevation change over 100 m horizontally. The 4 mm is an example, not a real site measurement. It gives an indication of the gradient, while the width of the terrain remains unknown. From the 500 m index contour, the first thin contour below it is 490 m. The next thick contour below 500 m is five 10 m steps down, at 450 m. Use the legend's interval to connect the line count to the elevation difference.
To estimate elevation between lines, identify the higher and lower lines and divide the gap into equal parts. In the source example, the space between 10 m and 20 m is divided into ten and the nearest value is read as 13 m. This is an approximation. The terrain itself need not slope uniformly.
Identify a ridge by the way contours bulge
The same material shows how to recognize the shape of a ridge. Ridges appear where contours bulge out away from a summit. Ridge contours are typically more rounded than valley contours, which often form sharper indentations and may include a stream symbol. Summits may have a triangulation point or a spot elevation and often mark where ridges start or branch.
The source explains how to recognize a ridge by its bulge and rounded shape. It gives no conversion from the size of the bulge to a width. As a practice exercise, make a light pencil mark along the contours that bulge outward from a summit's spot elevation. For valleys, check the shape of the indentation and look for stream symbols. At this point you can identify where the ridge is and the direction it runs.
What you can and can't tell about width
Wide spacing suggests a gentle slope. It cannot establish that a ridge is wide. This is the editors' inference from the source. A ridge has a crest and slopes on both sides, so contour spacing on one side leaves the shape of the other side and the breadth of the crest unknown. Small features between contour elevations can also be missing. GSI explains that where intermediate contours alone cannot adequately show a gentle slope or complex terrain, supplementary contours add 5 m or 2.5 m intervals. Sparse lines can still represent complex terrain.
Keep four quantities distinct. The first is elevation difference, which comes from the interval in the legend. The second is the spacing on paper, a horizontal distance that helps estimate steepness. The third is the horizontal extent of the ridge, which you cannot derive from that spacing alone. The fourth is the width and condition of the trail itself, which contours do not show. The sources provide no formula or numerical threshold to convert spacing to width.
As a planning exercise, divide your notes into two columns for each stretch of the route. On the left, record the contour spacing and the interval from the legend. To try the rough count, put a 2 cm diameter circle on a true-scale 1:25,000 map and use the count as a rough indication of average steepness only up to 40 lines. The original published diagram is marked as enlarged twofold, so don't treat the circle on screen as actual size. If you can't verify the conditions, record only whether the lines are close or far apart. On the right, record what remains unknown about width, including the extent of the ridge on either side, the width of the path, and footing. Filling the left column doesn't settle the questions on the right.
Before a section with unanswered questions, note where you can turn back or bypass it and what alternative route you could take. That gives you a choice before you reach uncertain terrain.
Shaded relief and profiles help you read terrain
GSI's shaded relief simulates light from the northwest. Northwest-facing surfaces appear light and southeast-facing surfaces dark. It is a terrain rendering rather than a photograph taken in sunlight. GSI explains that it can help identify ridges and valleys, so you can use it to check what you marked on the contours. The dataset described uses elevation tiles from April 2020. Boundaries between DEM5A, DEM5B, and DEM10B or between survey areas can produce step-like artifacts. An apparent step may be real terrain or a data boundary.
The GSI Maps profile tool plots elevation along a selected route and displays values as you move the pointer along the graph. A line across a ridge shows how elevation changes, but the profile alone does not define the points between which you would measure its width. The elevations in GSI Maps are derived from elevation tiles, and accuracy depends on the underlying data and terrain. On paper, draw a straight line and a set of parallel elevation guides. Transfer each contour crossing to the corresponding height and connect the points. A straight section follows a different line from a winding trail. Use the profile to understand the terrain and check access and safety separately.
To check a map or screen in the field, stop on stable footing where you won't block the trail. If there is no suitable spot, wait until there is. If you cannot make a sound decision about the next stretch, retain the option to turn back before entering it.
Use contour spacing to read steepness and record width separately
Use line spacing to judge steepness and handle ridge width separately. Find the ridge by the outward bulge and rounded shape of the contours, then use shaded relief or a profile to check your reading. Mark the ridge and trail widths as unverified where necessary and plan where you can turn back before entering a stretch that remains unclear.
References and sources
- Geospatial Information Authority of Japan | A beginner's guide to 1:25,000 topographic maps (4)
- Geospatial Information Authority of Japan | Reading elevation from a map
- Geospatial Information Authority of Japan | Map symbols: intermediate contours
- Geospatial Information Authority of Japan | Map symbols: index contours
- Geospatial Information Authority of Japan | Map symbols: supplementary contours
- Geospatial Information Authority of Japan | Shaded relief maps
- Geospatial Information Authority of Japan | Finding the elevation of the land
- Geospatial Information Authority of Japan | Contours: resources for grades 5 and 6
- Geospatial Information Authority of Japan | How elevation tiles are made and how GSI Maps calculates elevation