
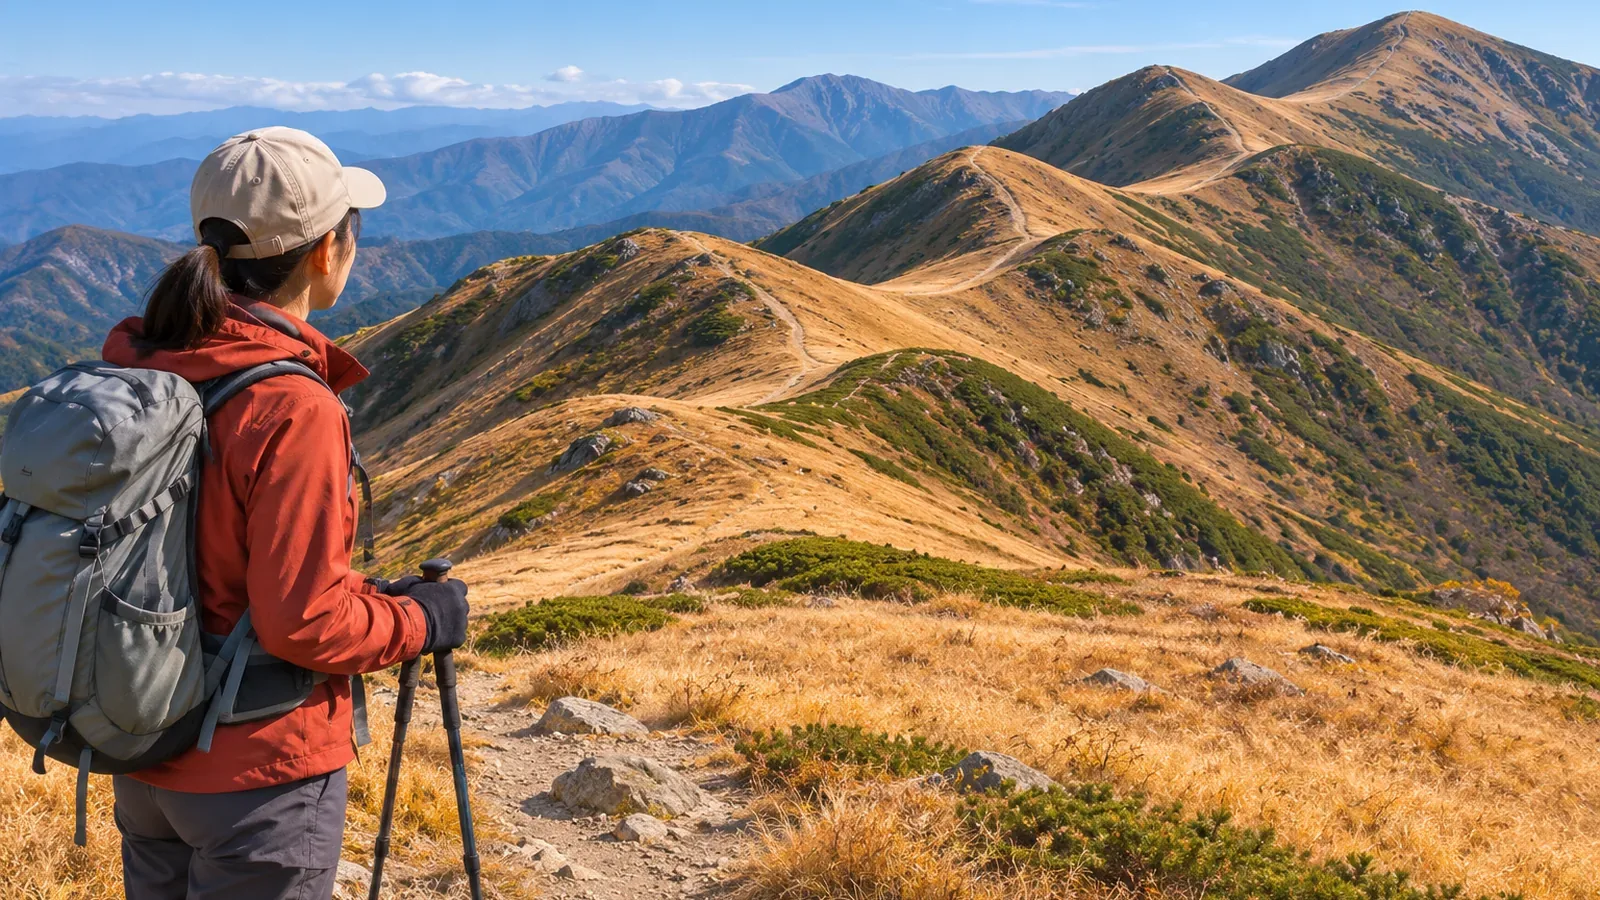
Knowing there are two climbs after descents still leaves two questions: how much do you climb each time, and what ascent would you face if you turned back from below? Using sources including GSI material checked on October 28, 2026, we'll record ascent, descent, and net elevation change separately. The columns and counting method are editorial suggestions.
Distinguish net elevation change from the amount you climb along the way
Here, a climb after a descent means an uphill section that follows a downhill one. This is a working definition for recording where you climb again along a planned route. Record the initial climb separately from the climbs that follow descents.
Imagine six points: start 1,200 m, first high point 1,350 m, saddle 1,290 m, next high point 1,420 m, low point 1,380 m, and finish 1,450 m. These are fictional elevations. Assume the route only climbs or descends in the indicated direction between each pair, without smaller rises or dips.
The three climbs are 150, 130, and 70 m, for 350 m of total ascent. The descents are 60 and 40 m, totaling 100 m. Subtracting 100 m from 350 m gives 250 m, which matches the net difference between 1,450 m and 1,200 m. By our definition, there are two climbs after descents: 130 m and 70 m. They count equally but differ in size.
A net gain of 250 m and a total ascent of 350 m describe different things. Give separate columns to the difference between start and finish, ascent on the way, and descent on the way. This keeps the net change from being copied into the total ascent column.
Use the high and low points you actually pass
Follow the planned route on the map and mark in order where climbing turns to descending or descending turns to climbing. Use existing mapped paths and check the elevations on the route itself. If the trail traverses below a summit, the summit elevation is not the route's high point. Mark any elevation you cannot read as unverified.
The National Diet Library's guide to maps with elevation explains that 1:25,000 topographic maps have 10 m intermediate contour intervals and 50 m index contour intervals. GSI gives 20 m and 100 m respectively for 1:50,000 maps. Check the map type and legend before applying a contour count to another map.
On a 1:25,000 map, the first intermediate contour below the 500 m index contour is 490 m. The next lower index contour is 450 m, five 10 m intervals below 500 m. Count intervals and lines separately. When an endpoint lies between lines, the number of crossings alone won't give an exact remainder.
GSI explains that where intermediate contours alone cannot show a gentle slope or complex terrain adequately, it adds 5 m or 2.5 m supplementary contours, with elevations labeled on the 2.5 m lines. Identify the line type before counting. Rises or dips that do not cross an intermediate contour can occur, so a map-based count may omit some climbs after descents.
Before starting down, record what you'd climb if you turned back
In the example, suppose you descend from 1,350 m to the 1,290 m saddle, then follow the same path back to 1,350 m. With no smaller rises and dips, that return segment has 60 m of ascent. The calculation shows why turning back after a descent can require climbing. A safe time to turn back or a safe amount to climb needs separate assessment.
In addition to start and end elevations, ascent, and descent for each section, add a column for what you'd climb if you retraced a descent. For the example, that's 60 m from 1,290 to 1,350 m. It applies to that section only. Check any further rises and dips on the way back to the start.
Use the column to review the route before starting down. Marking a junction or saddle on a map doesn't establish that it is a suitable rest or refuge point or that the trail will be open that day. Use decision points where you've checked the conditions and keep unknowns open.
Keep published walking times separate from the climb count. Find out which section and direction the times cover, and avoid adding a fixed number of minutes for every climb after a descent. The elevations alone don't determine duration, effort, or safety. Base your schedule and criteria for turning back on the route information you've verified and your group's circumstances.
Use the table to check three possible mistakes
First ask what the 250 m represents. If it's in the total ascent column, the net difference has been copied into the wrong place. Next check whether the two climbs after descents are equal. They are 130 m and 70 m. Finally, check whether turning back from the saddle is all downhill. Returning on the same path to 1,350 m requires a 60 m climb.
Subtracting total descent from total ascent checks the arithmetic in your table. Matching the difference between start and finish does not verify the route or the points chosen. Leaving out equal amounts of ascent and descent would produce the same net change. Check junctions, whether the route reaches the summit, and possible changes in elevation the map doesn't show.
GSI Maps can plot an elevation profile along a line and show the elevation under the pointer on the profile or route. If it differs from your table, check the route you drew and the points you selected. The values come from that route and the underlying elevation data. Verify the terrain, access, and any small rises or dips independently.
Keep the number of climbs, their size, and what a return would involve
Record net elevation change, ascent and descent by segment, and the number and size of climbs after descents. Note whether retracing a downhill stretch would mean climbing again. Use points on your actual route and distinguish contour types, intervals, partial intervals, and changes you can't read. Check the arithmetic and the route separately. On the trail, compare the map and terrain only after stopping on stable footing where you won't block anyone.
References and sources
- National Diet Library Research Navi | Maps that show elevation
- Geospatial Information Authority of Japan | Map symbols: intermediate contours
- Geospatial Information Authority of Japan | Map symbols: index contours
- Geospatial Information Authority of Japan | Map symbols: supplementary contours
- Geospatial Information Authority of Japan | Elevation profiles in GSI Maps
- Geospatial Information Authority of Japan | Finding the elevation of the land