
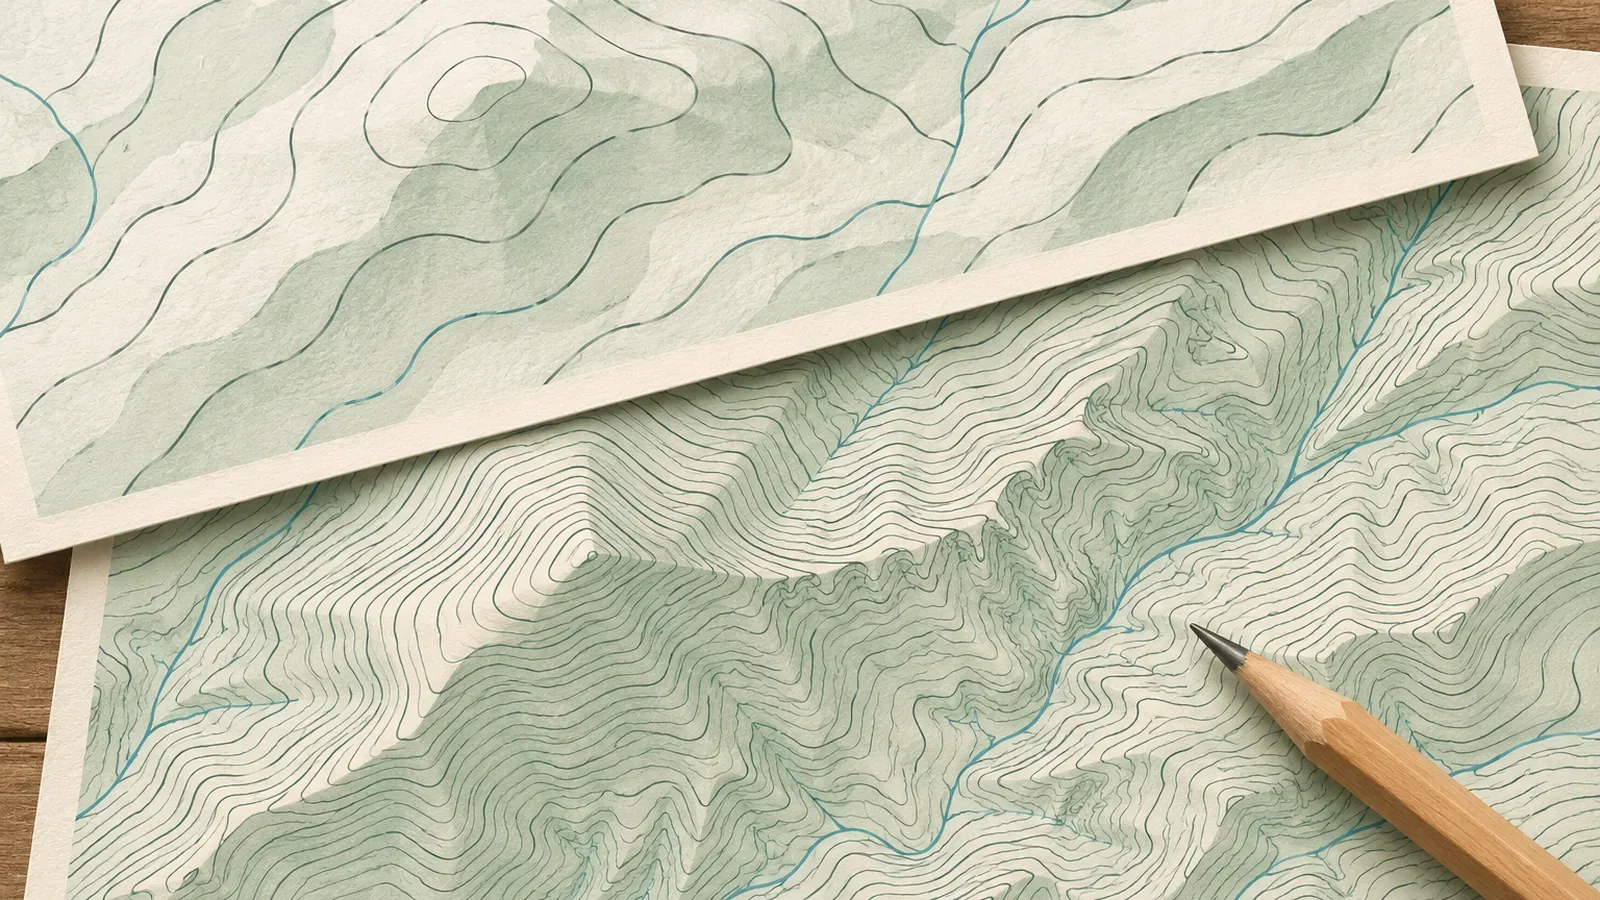
Switching between topographic maps made at different scales can change the contour interval and what is shown. Zooming or copying the same map at a different size adds no terrain information. Using sources checked on October 28, 2026, we'll distinguish spacing on paper from elevation and show how to avoid assumptions about small changes and total ascent.
The map type determines the elevation interval
The National Diet Library's guide to maps showing elevation was updated July 27, 2023. It lists intermediate and index intervals of 10 m and 50 m for 1:25,000 maps. At 1:10,000, they are 2 m and 10 m, or 4 m and 20 m on sheets that include mountainous terrain. The Geospatial Information Authority of Japan lists 20 m and 100 m for 1:50,000 maps. These are descriptions of map types. They do not constitute a review of every new mapping specification in 2026.
Here, contour interval means the vertical difference in elevation. Spacing on paper is how many millimeters separate the lines on the map. We'll keep those measurements separate.
Supplementary contours can add detail in gentle or complex terrain where intermediate contours are insufficient. Their intervals are 5 m or 2.5 m, with elevation labels on the 2.5 m lines. Use your map and its legend to see where supplementary contours are present. The library also notes that larger-scale maps with closer elevation intervals make it easier to read elevations.
The same elevation gain can involve different numbers of contours
Start at the 500 m index contour on a 1:25,000 map and count down. The first intermediate contour below it is 490 m and the next index contour is 450 m. The 450 m line is the next thick line, five 10 m steps down. The calculation follows from the official intervals.
Compare a fictional 200 m climb with no descent. If the start and finish both lie on corresponding contours, there are 20 intermediate intervals at 10 m, 10 at 20 m, and 50 at 4 m. Between index contours, the same gain spans four 50 m intervals or two 100 m intervals. These are arithmetic examples. Counting the starting line gives a different number from counting the spaces between lines. If a route starts between contours or rises and falls, crossings alone won't give an exact gain.
When converting to elevation, identify the contour type and whether you counted intervals or crossings. Between adjacent index contours there are four thin lines if you count only intermediate contours. The count looks the same at 1:25,000 and 1:50,000, but the gain between thick lines is 50 m and 100 m respectively. Check labels and legends rather than counting supplementary lines as a full intermediate step or applying one map's rules to another.
The same spacing on paper can represent different elevation intervals
Imagine moving horizontally at right angles to the contours of a uniform slope. If gradient is rise divided by horizontal distance, the distance to the next contour is the interval divided by the gradient. Divide by the scale denominator to get the spacing on paper. Use a slope rising 10 m per 100 m horizontally. This is a fictional calculation, with no measurements from a real trail.
At 1:25,000, a 10 m rise takes 100 m horizontally, which is 4 mm on paper. At 1:50,000, a 20 m interval takes 200 m, also 4 mm on paper. At 1:10,000 in mountainous terrain, a 4 m interval takes 40 m, again 4 mm on paper. With a 2 m interval at 1:10,000, it takes 20 m, or 2 mm on paper.
The spacing on paper can be the same 4 mm even when the elevation intervals are 10 m, 20 m, and 4 m. In other words, the same slope can look similarly crowded at 1:25,000 and 1:50,000, while the 1:50,000 map draws fewer contours over the same elevation range. Compare scales and intervals as well as how crowded the lines look. The calculation assumes a uniform slope and these specific combinations. Real slopes vary, and it does not cover other maps such as Japan's National Base Maps.
Small changes can fall between contours
Imagine a rise and dip that stays between the neighboring 500 m and 510 m contours. Its lowest and highest points are less than 10 m apart vertically. That does not cap the total ascent. A fictional profile that repeats 501 m → 509 m → 501 m ten times has 8 m × 10 = 80 m of total ascent without crossing either intermediate contour. This arithmetic example illustrates the definition. It gives no actual mountain measurements or official threshold.
A change smaller than the contour interval can still appear if it crosses a contour elevation. Changes that don't reach an intermediate contour won't appear in its crossing count, though supplementary contours may show them. Check the line or number behind each reading before drawing conclusions about small features.
The National Diet Library notes that in densely built-up flat areas contours may also be omitted or hard to distinguish. An absent line can have more than one cause. Where you can't see contours, avoid using the interval as a ceiling for the size of features or total ascent. Check what nearby symbols, spot elevations, and other terrain information show.
To compare, look at the same section on maps made at two different scales. Record the intermediate and index intervals, elevations at points you can confirm, and where you cannot read the map. Leave total ascent unverified where you cannot determine it. A coarse interval doesn't establish more climbs, and a fine interval doesn't ensure an exact total. Distinguish enlarging the same image from consulting a map with different data. Verify elevations and current route conditions where needed.
To read the map or take notes in the field, stop on stable footing without blocking the trail. If there is no suitable spot, wait until there is one.
Check the intervals first and allow for changes between the lines
When changing maps, check the line types and vertical intervals again. Repeated small rises between intermediate contours can add to cumulative ascent, so a missing line does not set an upper limit. Equal spacing on paper may represent different elevation intervals. Record what you could read and what remains unclear when comparing the same section, and check effort and safety separately from contour interval or zoom.
References and sources
- National Diet Library Research Navi | Maps that show elevation (updated July 27, 2023)
- Geospatial Information Authority of Japan | Map symbols: intermediate contours
- Geospatial Information Authority of Japan | Map symbols: index contours
- Geospatial Information Authority of Japan | Map symbols: supplementary contours