
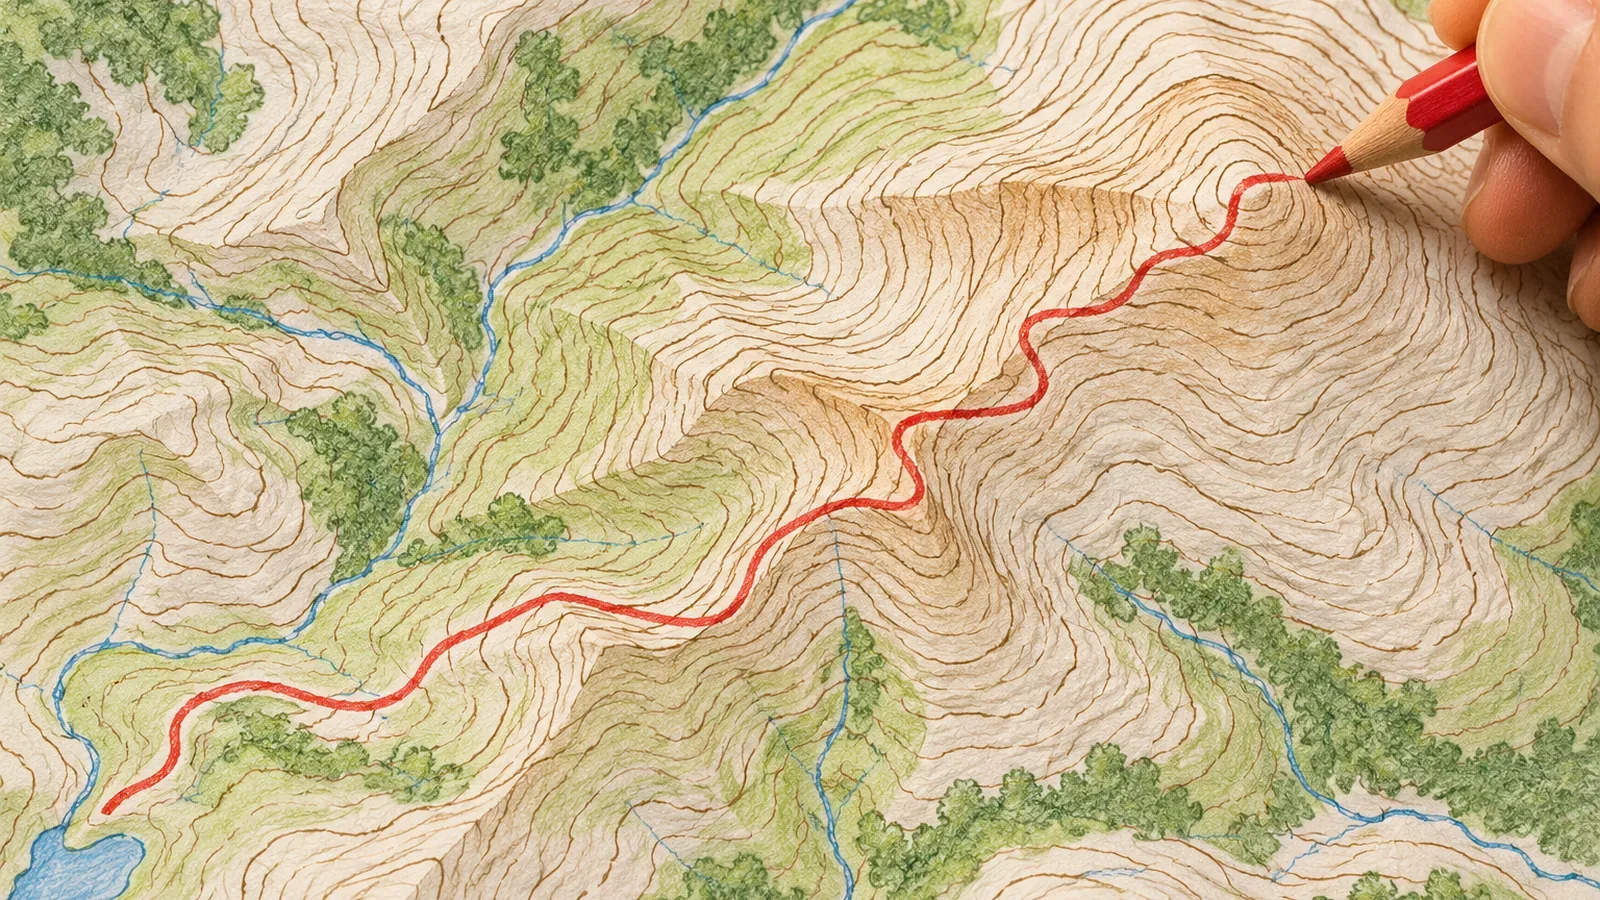
Trace an existing trail on a paper topographic map and list each waypoint’s elevation in order. You now have a way to explain where the route climbs and descends. Counting contours at a uniform interval gives you an estimate of elevation change. To say how steep the trail is, you also need horizontal distance. Drawing on GSI and other resources available on October 28, 2026, this article shows how to work through the map at a desk and what your notes can support.
Start by checking the contour interval on your map
Check how much elevation each step represents before you count. On Japan’s 1:25,000 topographic maps, ordinary intermediate contours are 10 m apart vertically and the heavier index contours are 50 m apart. At 1:10,000, the respective intervals are 2 m and 10 m, or 4 m and 20 m on sheets covering mountainous areas. At 1:50,000, the intervals are 20 m and 100 m. A single step on one sheet may represent a different rise or drop on another.
You may also see supplementary contours. These show subtle relief on gentle slopes or in intricate terrain where the intermediate contours alone cannot show its shape clearly. They are drawn at 5 m or 2.5 m intervals, with elevation labels on the 2.5 m contours. The guidance does not require them on every gentle slope. An area without these lines can still have small rises and dips.
Our suggestion is to note the intermediate and index contour intervals in the margin before you start. It is a simple check against mixing up the intervals. We have no figures on how often that mistake happens. Going downhill from the 500 m index contour on a 1:25,000 map, the next intermediate contour is 490 m and the next index contour is 450 m. There are five 10 m steps between 500 m and 450 m. Account for supplementary contours and points lying between two lines separately.
Turn a trail into a sequence of elevations
For this exercise, pick a walking trail already shown on the map. Between the start and finish, pick out junctions, high points and low points, and put them in a table. Use four columns: the name of the waypoint, its elevation and how you found it (a spot height or a count from an index contour), the horizontal distance from the previous waypoint, and the number of contour lines crossed uphill and downhill since that waypoint.
Use a piece of string or a ruler to follow the trail on paper and convert the length using the map scale. At 1:25,000, 1 cm on the map represents 250 m horizontally. The distance along the sloping trail is different. Fill out the table at a desk or another stable place where you can stop, with your attention free to study the map and write.
Here is a fictional example on a 1:25,000 map. The start is between the 430 m and 440 m contours, the first high point is in the 480s, a low point lies in the 460s, and the finish is a spot height of 523 m. If there are no other rises or dips, the trail crosses five 10 m contours on the first climb, two on the descent, and six on the final climb. Those counts alone leave the exact elevations between lines unknown. For the calculation, suppose the four elevations are 433 m, 483 m, 463 m and 523 m. The changes are +50 m, −20 m and +60 m, for 110 m of climbing and 20 m of descending. The finish is 90 m higher than the start, and the table shows the descent and climb back up in between.
When you explain the route, distinguish the waypoints you read from the map from any places where you might change the plan because of the weather or how you feel. Include alternatives whose conditions of use you checked in advance and mark anything still to be confirmed. A junction or symbol on a map cannot tell you whether you can safely turn back or whether the trail is passable that day. Your notes give others enough information to see what you found and what still needs checking when deciding on the itinerary.
A straight cross-section and a winding trail can tell different stories
GSI’s learning page shows how to draw a cross-section on paper in four steps. Draw a straight line across the terrain you want to study, and draw elevation guide lines parallel to it. Transfer each intersection with a contour to the corresponding height and connect the points. The example uses guide lines 100 m apart vertically. Choose an interval that suits the map you are working with.
The GSI exercise gives you a cross-section along a straight line. A winding trail can take quite a different path. Connecting its bends with straight lines can pick up elevations from places the trail never goes. One way to explore the difference is to break the route into roughly straight sections and compare them one at a time. Even then, you may miss small bends or changes in elevation. The map can still show some relief smaller than the contour interval.
On a computer, GSI Maps can plot an elevation profile along a line or route you specify. Hover over the graph or the selected route to see the elevation. If it disagrees with your table, check the line you traced and how you counted the contours. The accuracy of the values depends in part on the underlying elevation model. The graph cannot tell you whether the trail is in good condition or passable. Agreement between the two is a useful check on your reading of the map.
Record elevation, horizontal distance and your interpretation separately
Divide your short explanation into three parts. First, put down the elevations the map or your sources give you: the sequence from start to finish, the highest and lowest points, and the number of contours crossed. Second, record the horizontal distances measured on paper. Third, give your interpretation and list what you could not determine.
The number of evenly spaced contours you cross helps you estimate elevation change. To work out the gradient along the trail, you also need horizontal distance. A 40 m climb can feel quite different over a short horizontal distance than over a long one. This follows from the definition of gradient as elevation change divided by horizontal distance. The sources we consulted give no cutoff for a steep or easy trail based on how many contour lines it crosses.
At any given point on a smooth slope with a nonzero gradient, the steepest direction is perpendicular to the contour. Heading diagonally at that point cannot give a greater local gradient. MIT’s open calculus materials explain this using contours and directional derivatives. On a winding trail, use the direction of travel at the point in question. Comparing the average grade of a hillside on a coarse map with one short stretch of a real trail is a different calculation. The map may miss a step or ledge, so its estimate cannot put a ceiling on the steepest grade you might actually encounter.
In the third part, note uncertainties such as relief smaller than the contour interval, gentle slopes where you cannot tell whether supplementary contours were drawn, and current trail conditions. These are the points to check against up-to-date information before relying on your notes in the field.
Count the steps in elevation and use distance to estimate gradient
Note the contour interval, pick an existing trail and make a table of waypoint elevations and horizontal distances. Keep straight cross-sections distinct from winding trails and work section by section when needed. Compare your table with a GSI Maps profile as a map-reading check. When sharing your findings, separate the elevations you read, the distances you measured on paper, and your interpretation and uncertainties.
Tracing a route lets you explain the sequence of elevations the map shows and estimate the gradient using distance. Check current trail and access conditions separately, take stock of your situation in the field, and leave yourself the option to stop before committing to the next section.
References and sources
- National Diet Library Research Navi: Maps Showing Elevation
- Geospatial Information Authority of Japan (GSI): Map Symbols — Intermediate Contours
- GSI: Map Symbols — Index Contours
- GSI: Map Symbols — Supplementary Contours
- GSI: Contour Lines for Fifth- and Sixth-Grade Students
- GSI Maps Help: Elevation Profiles
- GSI: Finding the Elevation of the Land
- MIT OpenCourseWare: Calculus Study Guide, Chapter 13 (sections 13.1 and 13.4, PDF pp. 1 and 7)
- GSI: How Elevation Tiles Are Made and How GSI Maps Displays Elevation Values