
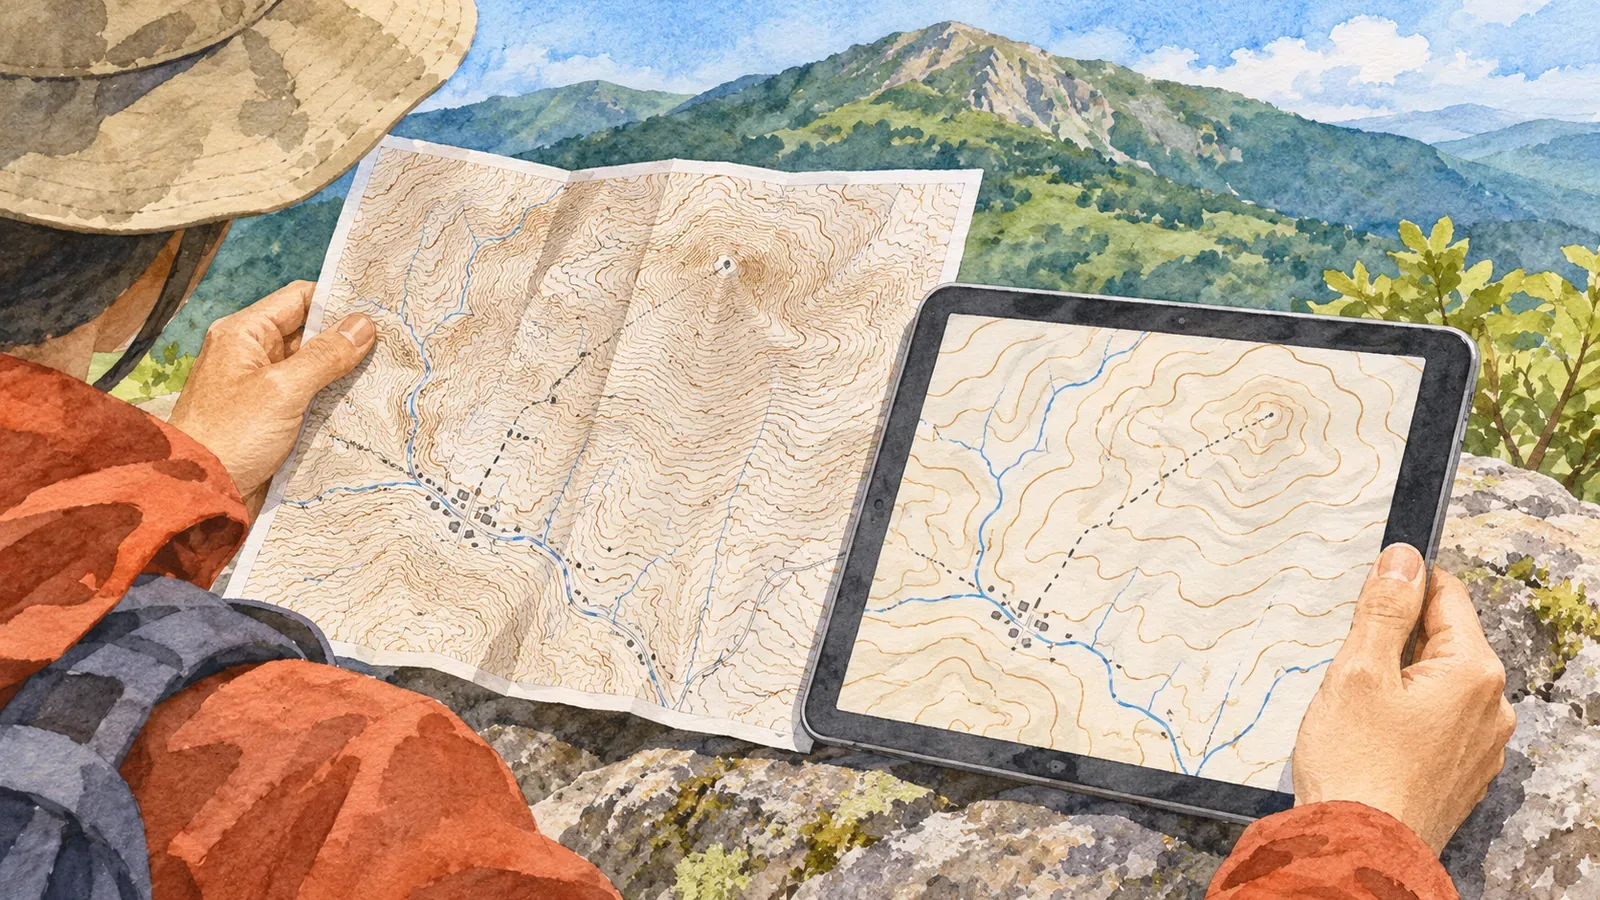
At 1:25,000 and 1:50,000, the same mountain can have different numbers of lines and symbols that look different. Before enlarging one map to align it with the other, check which products you are comparing and under what conditions. The examples here use GSI's printed 1:25,000 topographic map and Digital Topographic Map 50000. For the latter we use the standard that GSI applies to sheets updated from April 2026 onward. Other hiking apps and paper maps at 1:50,000 can follow different standards.
Record the product name as well as the scale
GSI's 1:25,000 specifications apply to maps printed on a printing press. The Digital Topographic Map 50000 standard applies to image-format map data presented at 1:50,000. The scale alone does not tell you which standard to use. Record whether you are looking at a printed map, a PDF or an app, as well as “25000” or “50000.”
The official Digital Topographic Map 50000 page describes the product as an overview of a wider area. It links to separate legends and standards for sheets issued from April 2023 to January 2026 and for sheets updated from April 2026 onward. The 50000 product name is the same, so check when your sheet was issued or updated and whether its legend matches the updated standard used here.
Record the product name, scale, sheet title, publication or update details, and the legend used together. Leave uncertain fields open so that the comparison can still be traced to the exact maps later. The history of individual symbols is a different question. First establish which two sheets you are comparing.
Match contours by elevation, regardless of their order
On GSI's printed 1:25,000 map, ordinary contours are spaced at 10 m intervals and index contours at 50 m. The Digital Topographic Map 50000 standard used here calls for ordinary contours every 20 m and index contours every 100 m. Thin ordinary contours and bold index contours may look similar on both maps even though they stand for different changes in elevation. Avoid matching the lines by counting them.
Suppose you can locate the 200 m and 300 m contours on both maps. They enclose the same elevation interval. Use the labelled elevations and the relationship to nearby ridges and valleys to compare the contours between them. Matching in order would pair lines at different elevations. The numbers illustrate the method, without referring to a particular mountain. Read the label on the thick line and use the legend to check the interval of the thinner lines around it.
The printed 1:25,000 specifications also allow supplementary contours at intervals of 5 m or 2.5 m where ordinary contours do not show enough detail. Both standards allow contours to be omitted on steep slopes where they cannot be drawn clearly. Check the line type and elevation before assuming a single interval for every line or treating fewer lines as proof of a gentle slope.
Include print magnification and PDF settings in the comparison
Showing the same page width looks different from making the same distance on the ground appear equal in both displays. At the original scales, 1 cm on a 1:25,000 map represents 250 m on the ground, and 1 cm on a 1:50,000 map represents 500 m. Print the latter at 200% in both dimensions and the original 1 cm becomes 2 cm on paper. Those 2 cm still represent 500 m. After scaling, use more than the ratio printed on the map to convert a ruler measurement.
This is how print scaling works. Enlarging the 1:50,000 map cannot add detail that was absent from the original. Matching contours at equal elevations and measuring printed distances are separate tasks. If you used “fit to page” or do not know the print scale, check the settings before comparing lengths.
The official page says that the Digital Topographic Map 50000 PDF has five layers you can show or hide: map surround, labels and symbols, base map, slope gradient, and shaded relief. If a symbol is visible on only one map, check the PDF display settings. The site also warns that some browsers cannot use the layers. A difference that remains unexplained does not prove that a feature has disappeared.
Consider changes on the ground and differences in what gets drawn
The Digital Topographic Map 50000 specifications allow features to be selected to suit the map. A symbol missing from one edition does not tell you the object no longer exists. Check what the standard covers, when the sheet was updated and how the PDF is displayed. Anything that remains unclear should stay on the list of things to verify.
Our editorial team suggests recording four items: landmarks confirmed to be the same, elevations of matched contours, symbols that differ, and the legends and settings you checked. Compare one section at a time. If you find a mismatch, avoid shifting the whole map to line it up or treating the gap between maps as the width of walkable ground. These comparisons do not measure current conditions on the trail.
The Japan Sport Council's training manual recommends using the latest information available and checking whether trails on a topographic map have been abandoned. Agreement between two maps leaves current trail conditions to be checked in the latest route notices. Prepare alternates and the way back with the same care as the main route.
Compare the scale, elevations and display settings
When comparing maps at different scales, check the product and edition, then use the legend to find contours at the same elevation. Record the print scale and PDF display settings. Keep unexplained differences open and use current route notices to verify trail conditions.
References and sources
- Geospatial Information Authority of Japan (GSI): 2013 specifications for 1:25,000 topographic maps, scope of the printed standard and contour lines
- GSI: Digital Topographic Map 50000 specifications, for sheets updated from April 2026 onward
- GSI: Digital Topographic Map 50000, product, applicable editions and PDF layers
- Japan Sport Council: Mountaineering manual for high school instructors, Part 2, Chapter 1, Safe Mountaineering with the PDCA Cycle, printed p. 26