
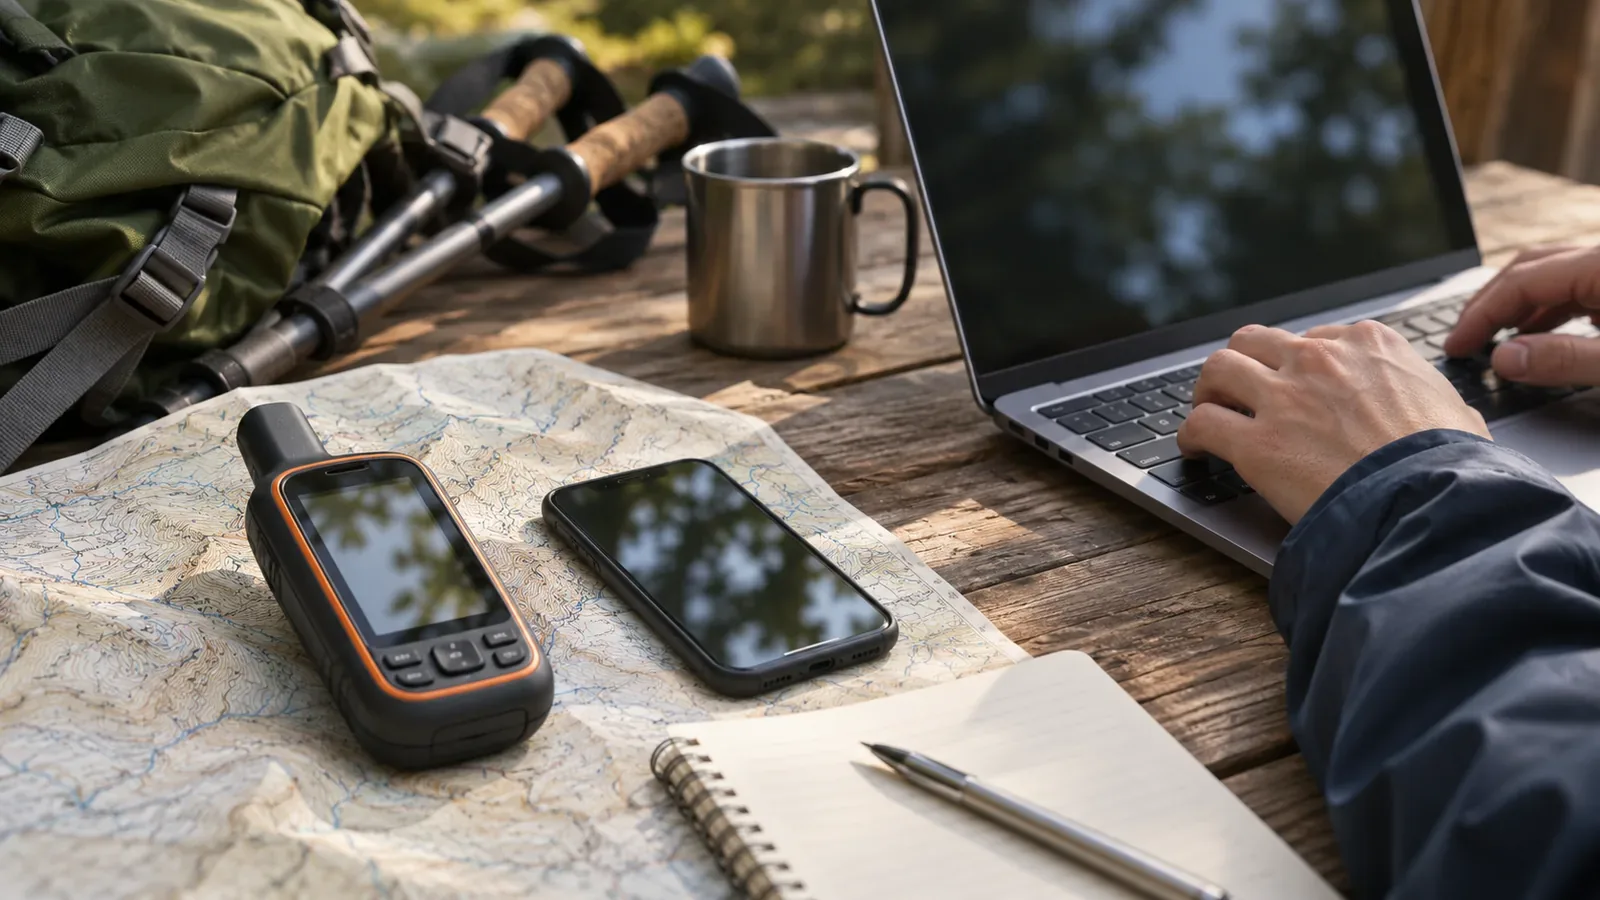
Labels such as “GPS-enabled,” “multi-band” and “RTK” cannot tell you what accuracy to expect in the mountains. The public and technical sources available as of October 28, 2026, use figures that measure different things, with different probabilities and conditions. This article explains how to interpret those labels and figures and what you can check at home before a hike.
A positioning label identifies a method and tells you little about the result
Japan’s Geospatial Information Authority uses GNSS as an umbrella term for satellite positioning systems including Michibiki (Japan), GPS (United States), GLONASS (Russia) and Galileo (EU). The name identifies a system or a method. GPS.gov explains that accuracy depends on satellite geometry, signal obstruction, atmospheric conditions, and receiver design and quality. Two devices can support the same system and still yield different results depending on the receiver and location.
Methods do differ. Japan’s Geospatial Information Authority describes about 10 m of error for standalone positioning, in which a single receiver estimates its distance from at least four satellites, a few metres for differential GNSS (DGNSS), and a few centimetres for real-time kinematic positioning (RTK). Network RTK uses observations from GNSS reference stations to provide centimetre-level positioning in real time. These figures come from a surveying and reference-station context, in which differential methods rely on correction data or multiple receivers. The sources cannot confirm which method your watch or phone actually uses. Read accuracy figures in light of the conditions the method needs to work.
“A few metres” can describe different quantities and probabilities
Similar-looking figures can describe different quantities. GPS.gov gives a standard of 2.0 m or less with 95% probability for the daily global average user range error (URE) across healthy satellites. This refers to signals broadcast in space. The site distinguishes URE from device positioning accuracy, which depends on satellite geometry and URE as well as local conditions such as obstruction, the atmosphere and receiver quality.
The GPS.gov table evaluating performance in 2022 shows figures for Position/Velocity/Time Service Accuracy (§3.8.3) separately from signal-in-space (SIS) metrics. The L1 C/A service thresholds at 95% are 8 m or less horizontally for the global average and 15 m or less at the worst site, and 13 m or less vertically for the global average and 33 m or less at the worst site. The table marks these thresholds as met. They differ from the signal ranging error (§3.4.1, SIS URE) and do not come from measurements taken in the mountains in 2026.
A third set of figures comes from the 2020 Standard Positioning Service (SPS) standard. It reports that, at 2018 signal-in-space accuracy, well-designed GPS receivers had achieved errors of 3 m or less horizontally and 5 m or less vertically 95% of the time. The passage concerns L1 C/A and offers no guarantee for a current model. Fourth, GPS.gov gives a radius of 4.9 m (16 ft) as typical for a GPS-enabled smartphone under open sky. It notes that accuracy worsens near buildings, bridges and trees.
Fifth, consider the device’s own estimate. Android’s Location.getAccuracy() returns an estimated horizontal accuracy radius in metres at the 68th percentile confidence level. It applies to horizontal position and is valid when hasAccuracy() is true. Compare figures only after checking that they use the same probability. A 95% figure and a 68% figure use different thresholds. The sources do not supply a basis for converting between them. This is the definition of the API value. Check separately whether your map app draws its circle using that value directly.
In the mountains, signal obstruction and reflection matter
GPS.gov lists signal obstruction by buildings, bridges and trees, indoor or underground use, and signals reflected off buildings or walls (multipath) as common causes of position errors. Less common causes include interference or jamming, major solar storms, and temporary loss of coverage during satellite maintenance. The 4.9 m figure is for open sky. A small error at the trailhead might grow once you enter a valley or a wooded stretch.
Multi-band sounds promising for hiking. In a Garmin interview, an engineer explains that receivers using L1 and L5 can give more continuous and accurate positions than conventional L1 receivers where signals reach the device but are degraded by reflections. Areas under a dense forest canopy and city streets between tall buildings, where reflections are frequent, are mentioned as examples where it can help. Extra measurements can also help a receiver judge how much confidence to place in a fix. The engineer notes that no method ensures signals will always work in every environment. This is a manufacturer’s blog post. It gives neither specifications for an individual model nor a numerical accuracy guarantee.
Our interpretation is that a multi-band label offers a lead when investigating performance around reflective surfaces, without specifying the improvement or ensuring reception where signals cannot reach the device. The GPS.gov page also says that most civilian receivers were single-frequency and that dual-frequency equipment was mainly for specialist use, while the SPS standard describes L2C and L5 as pre-operational. These descriptions date to around 2020–2022. Check current device specifications and signal status separately.
Five questions to ask about an accuracy figure before you leave
The following is our suggested checklist based on the material above. First, what does the figure measure: signal error, a service threshold, a device estimate or a test result? Second, what probability does it use, such as 95% or 68%? Write “unknown” if none is stated. Third, does it refer to the horizontal or vertical dimension? Fourth, what conditions apply: open sky, global average, worst site or something else? Fifth, when was the figure published and to which model does it apply?
At home, copy the positioning labels and accuracy figures from the official page for your equipment, then work through those five questions. If you are looking at two devices, lay out columns for the label, figure, probability, dimension, conditions and date of the source. This will show you which figures you can compare. Mark any missing answers as “unknown” and leave those figures out of your decision. Check the manual or official specifications to find out whether the model supports the feature and whether it is active under your settings.
On your map, mark the spots where you will need a reliable position, such as valley floors, wooded stretches and trail junctions. Decide ahead of time that at those spots you will cross-check the map against terrain and signs. If you cannot confirm your position, stop short at a safe place and skip that stretch or turn back. Set that rule before looking at the accuracy figures. Use the figures to allow for uncertainty. If you need to look at a screen or take notes, first stop somewhere with stable footing and room for others to pass. Wait if there is no suitable spot. Avoid making notes or using the screen while walking.
Summary: Start with the label and check the definition and conditions
Terms like GNSS, GPS, multi-band and RTK help explain how a device works. Published figures may describe signal error, service thresholds or estimates from a receiver. Their probabilities and conditions can also differ. Compare equipment only after checking that the figures measure the same thing under the same conditions and at the same probability. Before leaving, mark points where it will matter to know your location and decide where you will stop if you cannot confirm it.
References and sources
- GPS.gov, “GPS Accuracy”
- GPS.gov, “GPS Performance”
- Android Developers, “Location.getAccuracy()”
- Geospatial Information Authority of Japan, “What is GNSS positioning?”
- Garmin, “Why Multi-band? Q&A with Garmin Engineer Jared Bancroft”
- U.S. Department of Defense, “GPS Standard Positioning Service Performance Standard, 5th Edition”