
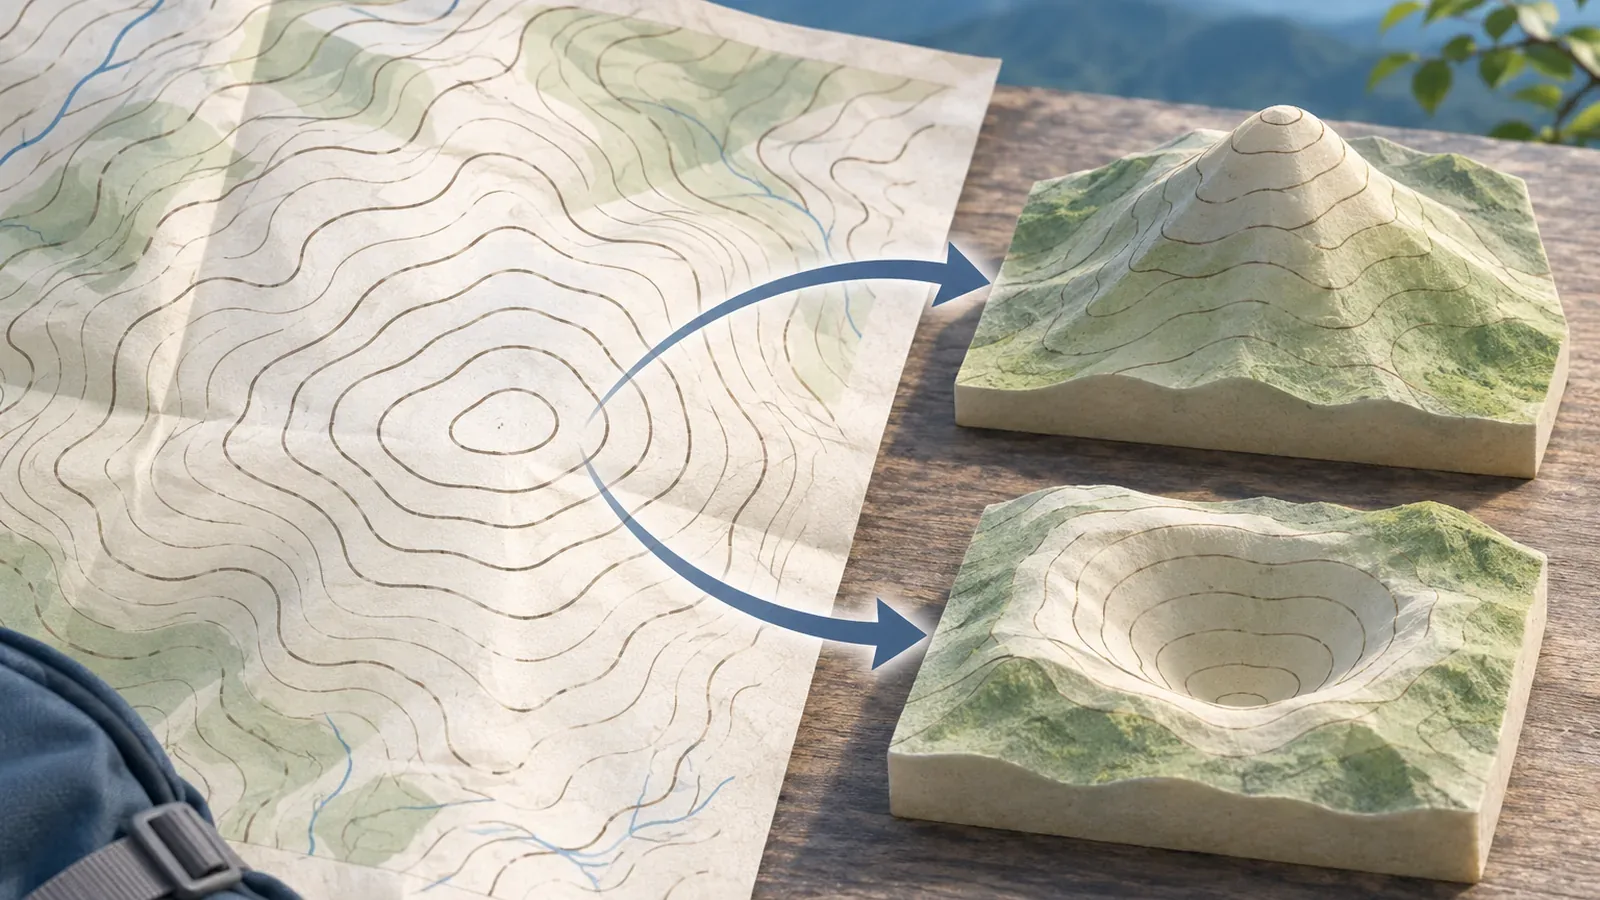
A closed loop on a map can mark a summit or a depression. Use elevation labels and symbols to tell whether the inside is higher or lower. With the Geospatial Information Authority of Japan's official depression illustrations and explanations checked on October 28, 2026, we'll work through reading the inside and outside of a loop and leaving uncertain points open.
Check whether elevation rises as you go inward
Contours connect points of the same elevation. A closed shape and higher ground inside it are separate pieces of information. Its length, roundness, or size alone cannot show whether going inward means climbing or descending.
For a practice example, imagine an outer contour labeled 500 m and a nested contour of the same feature labeled 510 m. Going from the outer line to the inner one gains 10 m. If the outside is 500 m and the inside 490 m, the move inward loses 10 m between those two lines. Assuming a summit from the shape alone can reverse the reading. These figures are fictional.
Even when you know the elevations of two lines, you cannot tell the exact high or low point inside the innermost loop from them. Trace each number to its line so you don't use a label from a different loop. Where the contours are too crowded to follow, leave the direction of the elevation change unverified.
On GSI's 1:25,000 topographic maps, intermediate contours are at 10 m intervals and thick index contours are at 50 m intervals. At 1:50,000 these are 20 m and 100 m. Check the interval on your map before counting rings, and distinguish index, intermediate, and supplementary lines when calculating elevation change.
Check the official depression symbol and when it is omitted
GSI's small land depression symbol describes a localized hollow in the ground. In the official illustration, an arrow points inside the loop. The digital topographic map 25000 standard shows the small depression arrow pointing from higher ground toward the lowest part. On large depressions, short strokes extend inward from the contours. Read the depression symbol along with the loop.
GSI explains that it omits the symbol when features such as breakwaters, earth cliffs, rock cliffs, or large rocks already indicate the downhill direction. An absent arrow alone does not establish a summit. Check what the other symbols mean in the official explanations or your map legend.
The page describes small depressions as features whose contour is less than 3 mm across on its shorter axis on the map. The size on the map is a drawing criterion, separate from how deep the hollow is. Use the map at its intended scale, and check the legend before applying the rule to another map or display.
The page also shows an example from Akiyoshidai in Mine, Yamaguchi Prefecture. Use it to compare official symbols with your map. The loops can represent different shapes. Check the symbol's meaning and the surrounding elevations together, rather than relying on a memorized arrow direction alone.
Check what each name and elevation label refers to
The National Diet Library lists printed elevations, contours, and survey control points among the ways to find elevations. Control points appear on 1:25,000 topographic maps too. Before using a number next to a loop, establish which point or line it labels. A nearby number may belong to something other than the highest point inside the loop.
GSI's FAQ explains that it labels major mountain names near their summits using information from municipalities. This is a labeling convention. An unnamed loop can still be a summit, and the center of a label does not locate the exact highest point. Use mountain names as clues and check them against line or spot elevations.
The same FAQ explains that hills made from piles of soil or rubble are labeled as land-use features. Mountain names are shown in italic type and land-use names in upright type. The lettering helps you identify how a name is classified. Use separate evidence to decide whether the ground rises or falls and whether you can get to it.
The National Diet Library also notes that maps may omit contours in densely built-up flat areas or show them unclearly. If you can't see a line or number, check another terrain source or leave it unknown. The innermost contour alone cannot give you the summit elevation.
Record the shape, numbers, and symbols separately
Try making three columns for a loop you want to check. In the first, just write that the line is closed. In the second, note the elevation and the point or line it belongs to. In the third, list any depression or cliff symbols you can identify. Then decide whether elevation rises inward, falls inward, or remains uncertain. This exercise keeps the shape from deciding the answer on its own.
To practice counting, start at the 500 m index contour on a 1:25,000 map. The next lower intermediate contour is 490 m and the next lower index contour is 450 m, five 10 m steps down. If endpoints fall between contours or the map uses supplementary lines, the number of crossings alone will not give an exact elevation difference.
Check for three common reading errors: reversing the rise and fall, copying a label from a different line, and relying on a missing depression symbol. When elevations and symbols seem to disagree, revisit the map type, legend, and the line you traced. Stay on your planned route rather than approaching the loop's center to check the terrain.
Read the elevations and depression markings together
A closed contour can enclose higher or lower ground. Compare its inner and outer elevations, look at GSI's depression symbols and when they are omitted, and check what nearby names and numbers refer to. Leave uncertain details unverified. Check access and footing separately. To read your map on the trail, stop on stable ground where you won't block others.
References and sources
- Geospatial Information Authority of Japan | Map symbols: small land depressions
- Geospatial Information Authority of Japan | Map symbols: intermediate contours
- Geospatial Information Authority of Japan | Map symbols: index contours
- Geospatial Information Authority of Japan | General map FAQ, Q3.10 and Q3.23 (updated September 9, 2022)
- National Diet Library | Maps that show elevation (updated July 27, 2023)
- Geospatial Information Authority of Japan | Digital topographic map 25000 display standard, depressions (symbol 108)