
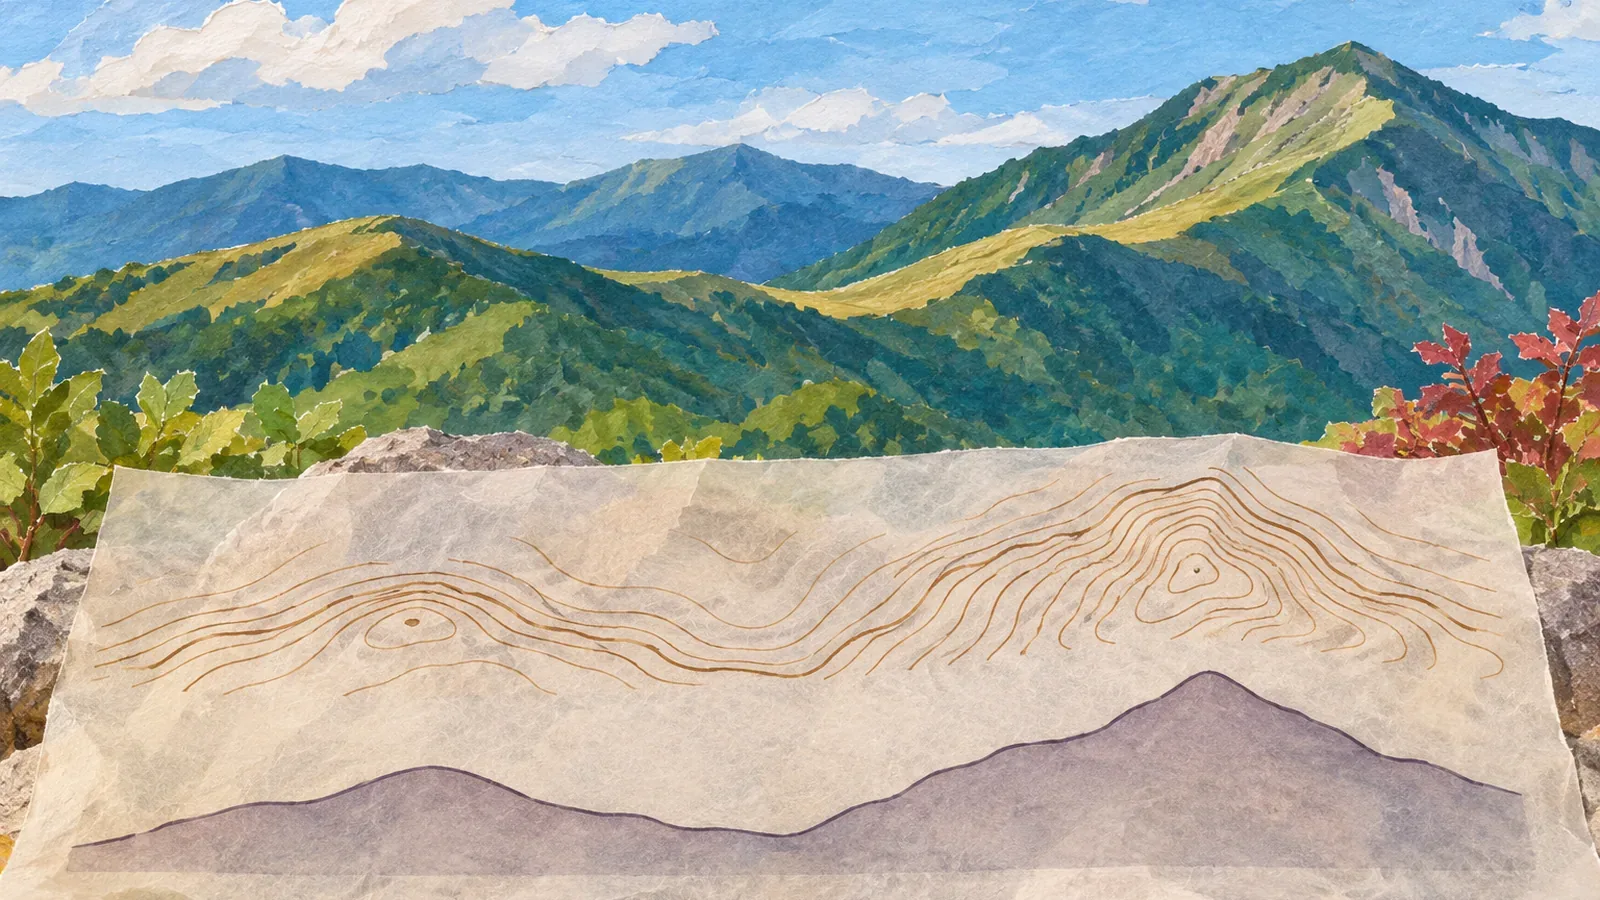
A view may resemble the shape in an elevation profile. Before comparing them, check whether they're showing the same feature. Using the Geospatial Information Authority of Japan's material checked on October 28, 2026, the editors propose a way to record the line used for the profile, the viewing direction, the display settings, and what was seen on the ground.
Distinguish the profile line from the direction you're looking
In GSI's paper exercise, you draw a straight line on the map, transfer each contour crossing to its elevation, and connect the points. The horizontal axis shows position along the line. The vertical axis shows elevation. The result traces a series of elevations along the line. A view from one place is a different kind of image.
The profile tool in GSI Maps also plots elevation along a selected line or route. Move the pointer over the graph or route to read the elevation at that position. Check what the line follows before comparing the shape in the graph with a ridge in front of you.
For the comparison, record the start, finish, and line used for the profile. Separately note where you plan to stand and which way you'll look. The trail, profile line, and viewing direction can differ. Record it if a straight line takes the place of a winding trail.
Two peaks in a profile may not both be visible from your observation point. Identify the mapped features and check how much is in view. Leave any uncertain match open. A similar shape alone cannot establish where you are or which mountain you're looking at.
Before leaving, note the line, scales, and estimated values
On GSI's 1:25,000 topographic maps, intermediate contours connect points of equal elevation at 10 m intervals. At 1:50,000 they are 20 m apart. In gentle or complex terrain where intermediate contours alone don't show enough, supplementary lines can add 5 m or 2.5 m intervals. The 2.5 m lines carry their elevation. Check the legend of the map you are using.
Separate elevations read at a contour from elevations estimated between contours. Contour crossings alone don't give a precise maximum or minimum between them. Seeing the route cross 430 m, for example, doesn't establish that the highest point must lie in the 430s. It depends on the area you considered and whether other lines were missed. Leave an unknown maximum unverified.
Before comparing how steep the profile looks, check the horizontal distance and vertical elevation scales. Different vertical and horizontal scaling makes the same data look different. A line's apparent angle in the graph doesn't measure the slope you walk on or the angle at which you look up from the trail.
Leave room for small rises and dips. Changes that don't cross an intermediate contour won't appear in the crossing count. Changes smaller than the interval may still show up when they cross a contour elevation. Record what you can establish from the map and what remains uncertain.
With a 3D view, record the viewpoint and vertical exaggeration
GSI's 3D help page explains how elevation models make a map three-dimensional. The page was last updated June 2, 2021. Check the labels and locations of controls in the version you're using and make a note of the settings.
The guide shows controls that display the east, north, and height axes and the distances north–south and east–west. You can rotate, move, and zoom the viewpoint and adjust vertical exaggeration. For a comparison with a 3D view, note the area shown, the direction, the viewpoint, and the exaggeration setting.
Changing a 3D view doesn't change the terrain. A setting that makes the shape resemble the view is not evidence of the observer's location, the feature's identity, or the model's accuracy. Record what you set in each tool, since the profile and the 3D model have different controls.
Keep what you saw separate from what you remember later
Try a table with three columns: what you expect to see, what you actually saw, and whether you could compare the two. Note the area you expected to see. For the observation, record where you stopped, which way you looked, and what features you could confirm. A view does not give an exact elevation by itself.
Make a comparison only when you can stop on stable footing without blocking the path. Leave recording and screen use until you're stopped, and stay on your planned route. If there's no suitable place or the view is obstructed, mark the comparison as not attempted or not visible. Review only the parts where conditions allowed a comparison.
Label details added later from memory as such, and keep anything rechecked on a map or 3D model separate. Leave the field record for features you saw on the trail. If you use a photograph, check where it was taken and which way it faces before assigning it to part of the profile.
If the profile and view differ, check the line against the route, your position and viewing direction, the visible extent, the contour interval, and the scales or settings. Keep several explanations open, including a reading error or a small feature missing from the map. Model elevations are derived from data, so leave the cause unresolved when you cannot verify it.
The comparison at home helps you reflect on your map reading. If you lose track of your position or route in the field, pause the exercise and establish where you are and where you should go. Stay on your route when checking views. A match between the table and profile does not establish that the trail is open, the footing is sound, or it's safe to continue.
Record whether you actually compared the same feature
To compare a profile with a view, record the line used for the profile, the scales, and where you stood and looked. Stop somewhere safe and record only the features you could confirm. Leave what you could not see open. Keep 3D settings and later recollections separate from field observations. The exercise helps you identify what you compared and what remains unverified.
References and sources
- Geospatial Information Authority of Japan | Contours: resources for grades 5 and 6
- Geospatial Information Authority of Japan | Elevation profiles
- Geospatial Information Authority of Japan | Finding the elevation of the land
- Geospatial Information Authority of Japan | Map symbols: intermediate contours
- Geospatial Information Authority of Japan | Map symbols: supplementary contours
- Geospatial Information Authority of Japan | GSI Maps 3D features (updated June 2, 2021)
- Geospatial Information Authority of Japan | How elevation tiles are made and how GSI Maps calculates elevation