
When you spot an extra contour, do you count it as another full contour interval? Using the Geospatial Information Authority of Japan's explanations and official symbols checked on October 28, 2026, we'll work through line types, intervals, and elevation labels. The fictional slope exercise and note-taking method are suggestions from the editors.
Check the purpose and appearance of supplementary contours in the official legend
GSI explains that supplementary contours are added where intermediate contours alone do not show the features of gentle slopes or complex terrain. They add elevation intervals of 5 m or 2.5 m between intermediate contours, with elevation labels on the 2.5 m lines. This does not mean every gentle slope or small feature gets an extra line.
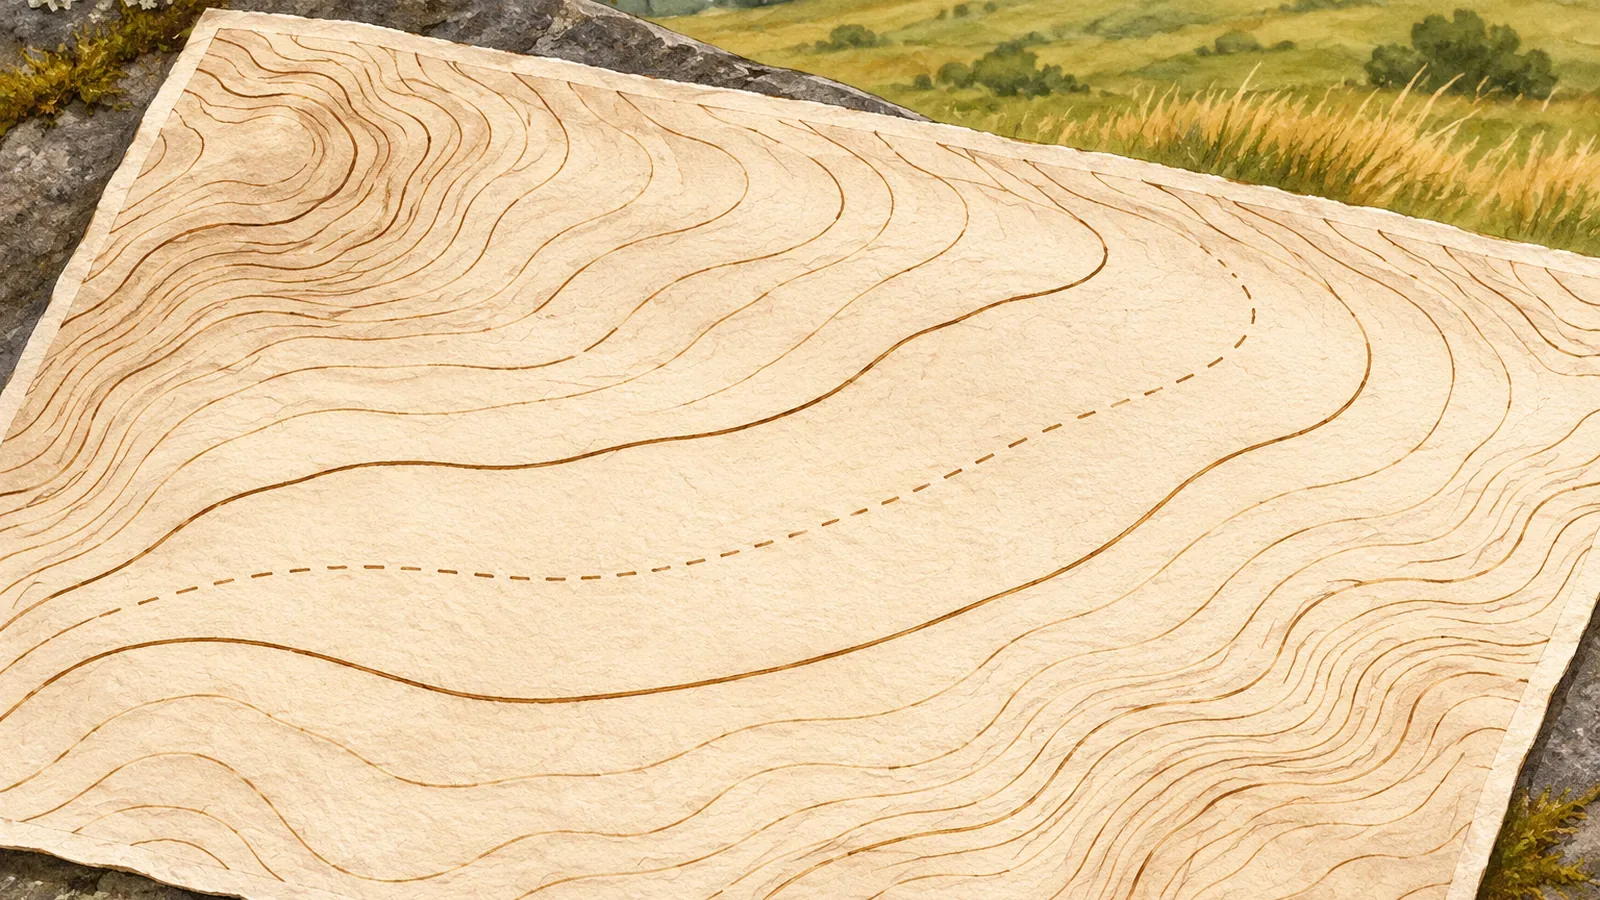
In the official illustration on the same page, supplementary contours appear as broken lines. Check the legend on the map in front of you before deciding what a line means. Other map products or digital displays may use different line styles and intervals. Leave any uncertain line unidentified.
On GSI's 1:25,000 topographic maps, intermediate contours connect points of equal elevation at 10 m intervals. On 1:50,000 maps the interval is 20 m. Index contours are the thicker lines at every 50 m on maps with 10 m contours, or every 100 m at 1:50,000. Keep the 5 m and 2.5 m supplementary intervals separate from the intermediate and index intervals.
Write down the elevation of each line and leave unknown values blank
Try making three columns in the margin: line type, label used as evidence, and elevation of the line. Start with a thick index contour and check which line its label belongs to. Follow the intermediate contours, then use the legend to identify any additional line and its interval. An unlabeled supplementary contour need not be halfway between the two intermediate contours.
Suppose you've confirmed that there is one supplementary line with a 5 m interval between the 1,240 m and 1,250 m intermediate contours. Then its elevation is 1,245 m. With a 2.5 m interval, possible elevations are 1,242.5 m, 1,245 m, and 1,247.5 m. Look at the map to see which lines are present and check the labels on the 2.5 m contours. A given map may show only some of those possible lines.
Distinguish a calculation with known inputs from a situation where the inputs are unclear. A confirmed 5 m interval supports an elevation of 1,245 m in this example. An absent label or a single line between two contours does not establish the interval or elevation. If a thin line is hard to make out, mark its interval or elevation as unverified until you can check the legend or another explanation.
The elevation of a contour and the elevation of a point between contours are different readings. Reading a 1,245 m line does not set the elevation of a point next to it or of nearby high or low points. Note whether your value comes from a contour, a labeled spot elevation, or an estimate between lines.
Test what one extra line tells you with an imaginary profile
In its guide to reading elevation from a map, GSI suggests finding the higher and lower contours bracketing a point and dividing the space evenly to estimate elevation. Its example divides the space between the 10 m and 20 m contours into ten and reads 13 m. The result is an estimate from a map. A field measurement would be needed to establish the actual elevation.
Imagine a straight line on the map following a slope that rises in one direction. Suppose the horizontal distance from the 1,240 m line to the 1,245 m line is 100 m, and another 200 m to the 1,250 m line. These are fictional distances. Both segments gain 5 m, but their average gradients are 5 ÷ 100 and 5 ÷ 200 respectively. The first segment is steeper on average.
A straight profile drawn using only the 1,240 m and 1,250 m endpoints would miss that change. With the 1,245 m crossing, you can show that the first 5 m of ascent occurs in 100 m of the 300 m distance. A uniform grade would put the 100 m point at about 1,243.3 m, rather than the 1,245 m in the example. The extra line gives you another known elevation along the profile.
Three points still leave the shape of the slope between them uncertain. The two calculated gradients are averages over those segments. They do not describe the precise gradient along a path, the footing, or any small steps in the terrain. Use the imaginary profile to practice reading added information and assess real slopes separately.
Avoid reading too much into how many lines appear
Supplementary contours increase the number of lines between two intermediate contours. The elevation difference between 1,240 m and 1,250 m stays the same. Counting every line as a full interval when calculating steepness or angle ignores the line type. Check each elevation first and measure the corresponding horizontal distance separately if you need the average gradient.
A place with no supplementary contours may still be uneven. A bump or hollow that does not cross the elevation of any intermediate contour won't change how many of those lines you cross. A height change smaller than the interval may still show up if it crosses a contour elevation. Some small features show up and others do not. This is how the editors interpret the definition of contours.
Review your notes: is the interval 5 m or 2.5 m? Is the value for a line or estimated between lines? Are the distances horizontal and measured in the same direction? Leave unreadable values unverified instead of entering zero. Extra contours do not change the actual terrain or show that it is easier to cross.
A map can give you a sense of the terrain, but it cannot establish the condition of the path, whether it is open, or how secure the footing is. To compare the map with your surroundings, stop where your footing is stable and you won't block the trail. If there's no suitable place, wait until there is and stay on your planned route.
Use supplementary contours as extra elevation points you can verify
Supplementary contours add detail where intermediate contours alone do not show enough relief. Compare the official illustration with your map legend, check for a 5 m or 2.5 m interval, and record which line you read. Adding a midpoint in a practice profile reveals differences you can't show with the endpoints alone. The shape between lines still needs interpretation. Keep confirmed values, estimates, and unknowns separate. Use more than line counts to estimate slope, and leave room for uneven terrain even where the map shows no extra line.
References and sources
- Geospatial Information Authority of Japan | Map symbols: supplementary contours
- Geospatial Information Authority of Japan | Map symbols: intermediate contours
- Geospatial Information Authority of Japan | Map symbols: index contours
- Geospatial Information Authority of Japan | Reading elevation from a map, PDF page 1